To view the full version and footnotes, please consult the PDF copy.
Introduction
The Canadian Human Rights Commission (CHRC) and the Office of the Federal Housing Advocate (OFHA) have legislated mandates to monitor human rights. Together, we are establishing a framework to monitor the right to adequate housing for people with disabilities in Canada. This framework helps to assess whether Canada is meeting its human rights obligations under Canadian and international laws, including the United Nations Convention on the Rights of Persons with Disabilities (CRPD) and the International Covenant on Economic, Social and Cultural Rights (ICESCR). Our work is designed to assist the Government of Canada in fulfilling its responsibility to monitor and report on its human rights obligations.
This monitoring framework tracks housing outcomes, policy efforts and government resources (i.e., spending) in the following eleven areas: institutionalization; homelessness; accessibility; the availability of supports and services; discrimination and dignity; affordability; security of tenure; safety; habitability; location; and cultural adequacy. You can find the indicators for all eleven areas on our website. This report presents the results for the outcome indicators on accessibility.
Accessibility is a core element of the right to adequate housing. According to the United Nations, adequate housing must be accessible, and disadvantaged groups, including older persons and persons with disabilities, must have full access to adequate housing resources. The United Nations Convention on the Rights of Persons with Disabilities (CRPD) defines universal design as designing environments to be usable by all people, to the greatest extent possible, without the need for adaptation or specialized design.
We are creating a baseline of results that can be updated as new data becomes available and to help measure progress. We use a variety of data sources to track outcomes, since no single source captures the lived experiences of all people with disabilities in Canada. We also recognize that there are gaps in the data being collected at the time of writing this report. We primarily drew on data from the Canadian Survey on Disability (CSD) from 2017 and 2022 and the Canadian Housing Survey (CHS) from 2021. These two surveys use the social model of disability to identify people with disabilities. We disaggregated data to the greatest extent possible, applying an intersectional approach, but due to data gaps we were unable to disaggregate fully. Notable results for particular intersections of identities were included when the data was available.
What people told us
People with disabilities told us they can't find accessible housing in Canada. They said this violates their human rights and limits their dignity and independence.
- “Finding housing that is accessible is horrific. It doesn't matter how much money you have. Everything that's being built excludes persons with disabilities. There is a brand new, very nice condo downtown. The front door has automatic doors, but the entrance is at the top of a flight of stairs!”
- “I could not find an accessible home. There are six steps to get into my home. The pain and difficulty I have is too much to bear. Sometimes I stay inside because of it.”
Analysis
Indicator 1: Percentage of people with disabilities who have housing that meets their accessibility needs
- The estimated number of people with disabilities who had or needed physical aids (for example, walk-in bath or shower) increased from 2017 to 2022. In 2017, there were an estimated 6,246,640 people with disabilities in Canada, and about 1,715,640 of them (27%) had or needed a physical aid. By 2022, the total number of people with disabilities had risen to an estimated 7,977,610, with about 1,928,520 people (24%) reporting having or needing a physical aid.
- The estimated number of people with disabilities who needed at least one type of physical aid but did not have it increased from 2017 to 2022. In 2017, an estimated 251,110 people with a physical disability (14.6%) reported at least one unmet need for physical aid. By 2022, this had risen to an estimated 310,330 people (16.1%) reporting at least one unmet need.
- Over the five years between 2017 and 2022, clear gender differences continued to appear in access to physical aids for people with disabilities. In 2017, most people said they had the physical aid they required. However, women with disabilities were much more likely than men to say they needed certain aids but did not have them (see Figure 1).
For example, 20.7% of women with disabilities needed a walk-in bath or shower but did not have one, compared with 14.3% of men with disabilities. Similar gaps existed for lowered counters, ramps, lift devices, bathroom aids, and automatic or easy-open doors.
These differences continued in 2022. Women with disabilities were still less likely than men to have the physical aids they needed, and they were more likely to report unmet needs across most types of aids (see Figure 2). For example, 18.5% of women with disabilities needed a walk-in bath or shower but did not have one, compared with 11.7% of men with disabilities.
Overall, the results show that women with disabilities face higher barriers to getting the physical aids they need. These gender differences did not improve over the five-year period, suggesting that women continue to experience greater challenges in accessing the supports that help them live safely and independently.
- More than 60% of people with disabilities are dissatisfied with how accessible their home is for someone using a wheelchair. About 61.7% of people with disabilities (approximately 3,875,990 households) report being dissatisfied with their home’s accessibility, compared with 55.3% of people without disabilities (approximately 4,791,840 households) (see figure 3).
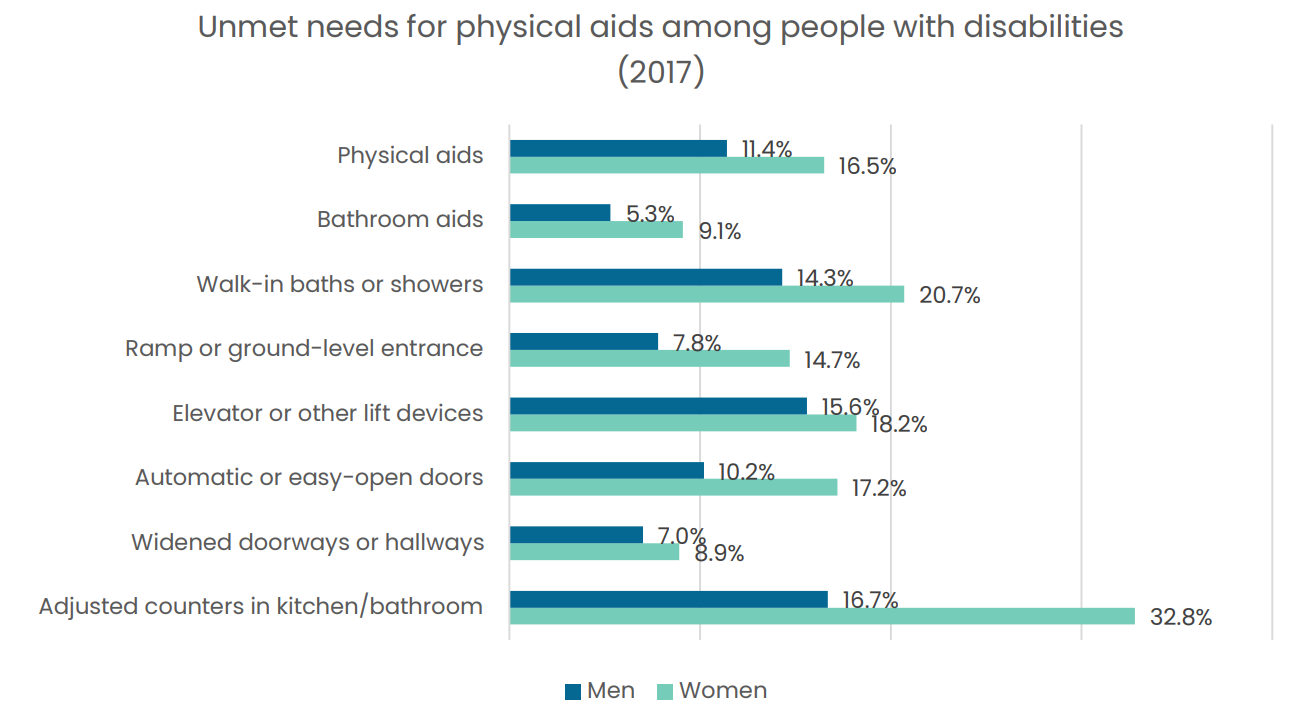
Figure 1 - Text version
| Men | Women | |
|---|---|---|
| Physical aids | 11.4% | 16.5% |
| Bathroom aids | 5.3% | 9.1% |
| Walk-in baths or showers | 14.3% | 20.7% |
| Ramp or ground-level entrance | 7.8% | 14.7% |
| Elevator or other lift devices | 15.6% | 18.2% |
| Automatic or easy-open doors | 10.2% | 17.2% |
| Widened doorways or hallways | 7.0% | 8.9% |
| Adjusted counters in kitchen/bathroom | 16.7% | 32.8% |
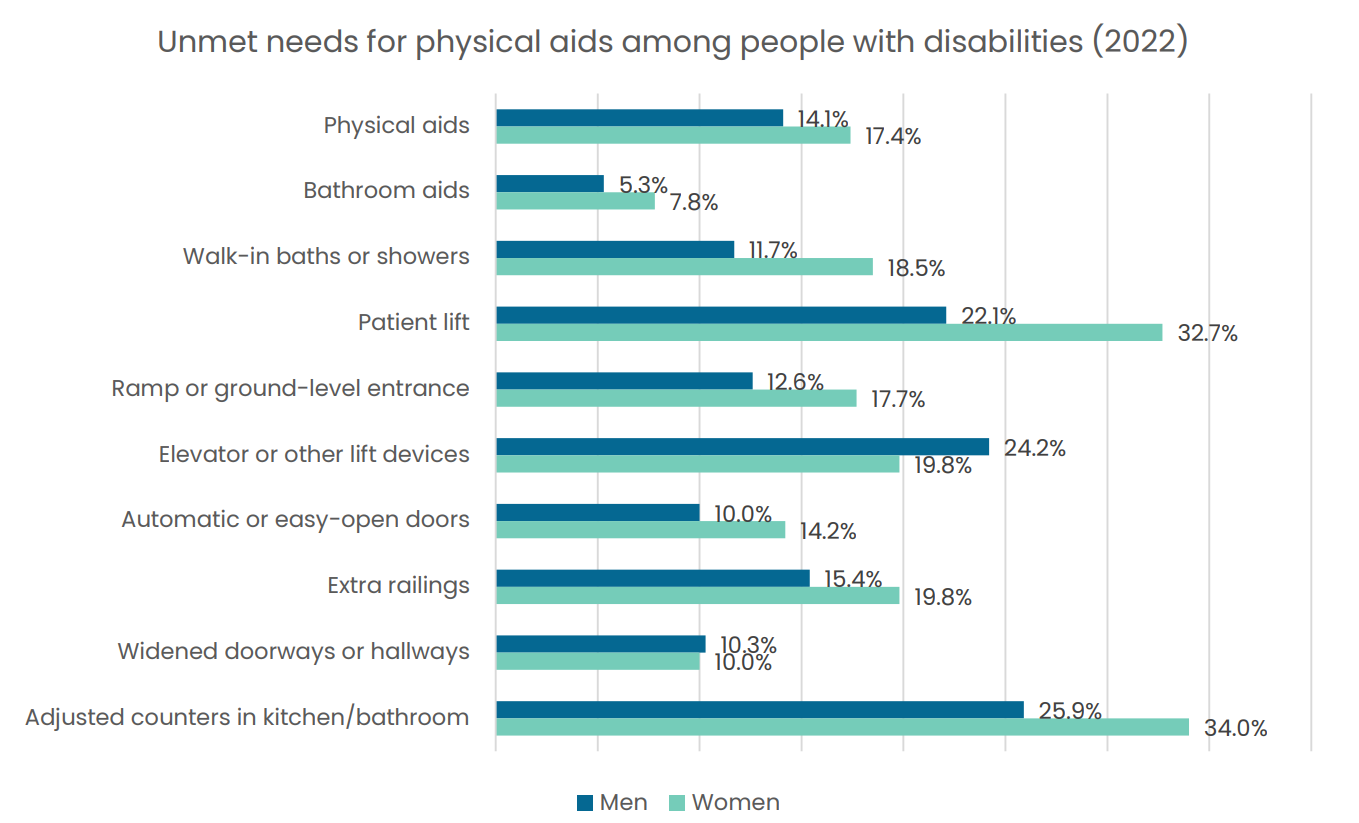
Figure 2 - Text version
| Men | Women | |
|---|---|---|
| Physical aids | 14.1% | 17.4% |
| Bathroom aids | 5.3% | 7.8% |
| Walk-in baths or showers | 11.7% | 18.5% |
| Patient lift | 22.1% | 32.7% |
| Ramp or ground-level entrance | 12.6% | 17.7% |
| Elevator or other lift devices | 24.2% | 19.8% |
| Automatic or easy-open doors | 10.0% | 14.2% |
| Extra railings | 15.4% | 19.8% |
| Widened doorways or hallways | 10.3% | 10.0% |
| Adjusted counters in kitchen/bathroom | 25.9% | 34.0% |
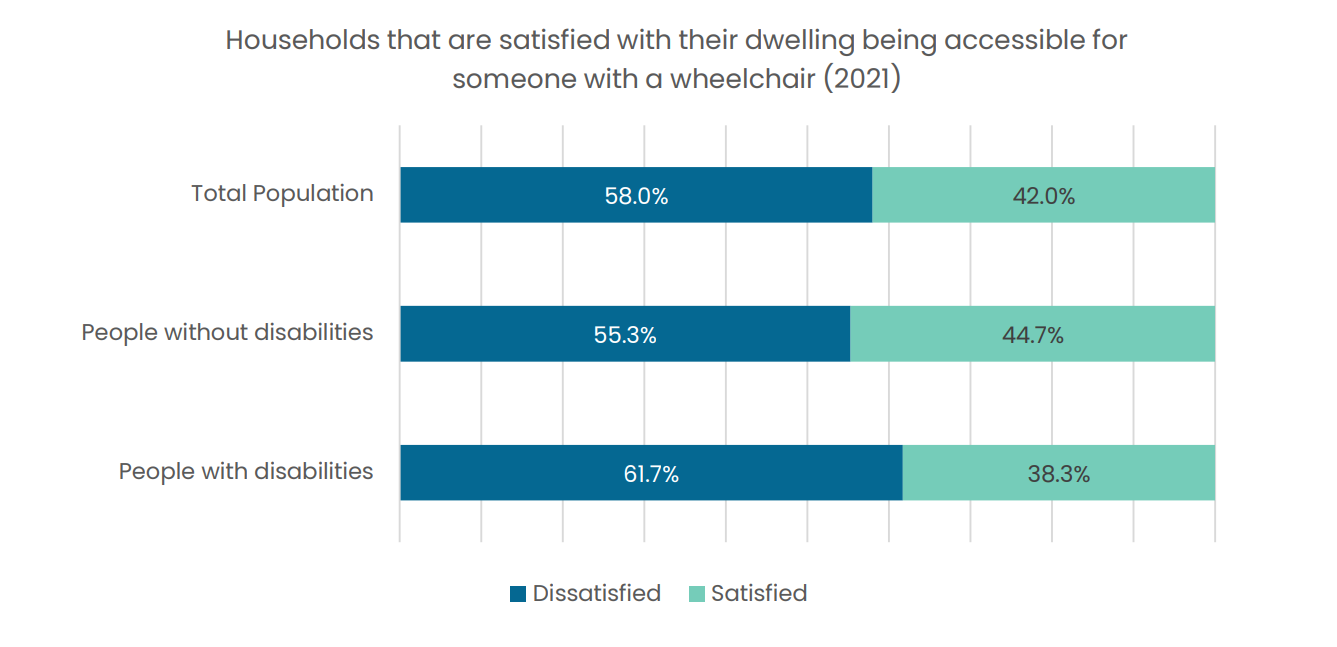
Figure 3 - Text version
| Dissatisfied | Satisfied | |
|---|---|---|
| People without disabilities | 55.3% | 44.7% |
| People with disabilities | 61.7% | 38.3% |
| Total Population | 58.0% | 42.0% |
Indicator 2: Number of accessible housing units in each jurisdiction, including on reserves
- Results: Not available. This data is not currently collected through national or provincial / territorial surveys. We are advocating for better data collection and transparency in this area.
Indicator 3: Number of adaptable housing units in each jurisdiction, including on reserves
- Results: Not available. This data is not currently collected through national or provincial / territorial surveys. We are advocating for better data collection and transparency in this area.
Indicator 4: Number of social and affordable housing units that are publicly owned and accessible
- Less than 1 in 10 publicly owned social and affordable housing units are accessible in Canada. In 2016, an estimated 9.8% of these units were accessible. By 2020, this share had declined to 8.9%.
Indicator 5: Percentage of people with disabilities who paid for their homes to be adapted
- Results: Not available. This data is not currently collected through national or provincial / territorial surveys. We are advocating for better data collection and transparency in this area.
Indicator 6: Percentage of homeless shelters, transition houses and emergency shelters that are accessible
- Results: Not available. This data is not currently collected through national or provincial / territorial surveys. We are advocating for better data collection and transparency in this area.
Conclusion
In conclusion, the number of people with disabilities who had or needed physical aids increased over time, and more people reported needing aids they did not have. Women with disabilities continued to face greater barriers than men in accessing the physical aids necessary for safe and independent living, with these gender differences showing no improvement over the five-year period (2017-2022). Many people with disabilities do not have homes that meet their accessibility needs and only a small share of publicly owned social and affordable housing in Canada includes accessible features. Overall, these findings based on the available data underscore the persistent shortage of accessible housing that meets the specific needs of women and gender diverse people with disabilities, including access to vital physical aids. Addressing the housing needs of persons with disabilities in Canada will require a comprehensive approach that incorporates inclusivity, accessibility, and adaptability.
Read our report with recommendations to address these issues.