To view the full version and footnotes, please consult the PDF copy.
Introduction
The Canadian Human Rights Commission (CHRC) and the Office of the Federal Housing Advocate (OFHA) have legislated mandates to monitor human rights. Together, we are establishing a framework to monitor the right to adequate housing for people with disabilities in Canada. This framework helps to assess whether Canada is meeting its human rights obligations under Canadian and international laws, including the United Nations Convention on the Rights of Persons with Disabilities (CRPD) and the International Covenant on Economic, Social and Cultural Rights (ICESCR). Our work is designed to assist the Government of Canada in fulfilling its responsibility to monitor and report on its human rights obligations.
This monitoring framework tracks housing outcomes, policy efforts and government resources (i.e., spending) in the following eleven areas: institutionalization; homelessness; accessibility; the availability of supports and services; discrimination and dignity; affordability; security of tenure; safety; habitability; location; and cultural adequacy. You can find the indicators for all eleven areas on our website. This report presents the results for the outcome indicators on affordability.
Affordability is a core element of the right to adequate housing. According to the United Nations, housing is not affordable if its cost forces people to sacrifice other basic needs such as food, healthcare, transportation, or essential supports. For many people with disabilities, affordability also includes the ability to pay for disability-related expenses while remaining securely housed.
We are creating a baseline of results that can be updated as new data becomes available and to help measure progress. We use a variety of data sources to track outcomes, since no single source captures the lived experiences of all people with disabilities in Canada. We also recognize that there are gaps in the data being collected at the time of writing this report. We primarily drew on data from the Canadian Survey on Disability (CSD) from 2017 and 2022 and the Canadian Housing Survey (CHS) from 2021. These two surveys use the social model of disability to identify people with disabilities.
For this report, we also used the Canadian Income Survey (CIS) from 2019, which provides information on income and poverty that is not available in other disability-focused datasets. The CSD and the CIS identify people with disabilities in different ways. Because their populations, sampling frames, and disability measures differ, results from these two surveys should not be directly compared. We also incorporated data from the Indigenous Peoples Survey (2017), which provides important insights into the barriers experienced by First Nations people living off reserve, Métis, and Inuit, including disability-related experiences not captured in other surveys. We disaggregated data to the greatest extent possible, applying an intersectional approach, but due to data gaps we were unable to disaggregate fully. Notable results for particular intersections of identities were included when the data was available.
What people told us
People with disabilities told us there is not enough affordable housing, and the waitlists for affordable housing are very long. They said they sometimes have to live with strangers because they cannot afford to live alone.
- “I make less than $15,000 a year, and $12,000 of it goes to my shelter. I live in constant fear of becoming homeless. I receive food from the food bank, but it's not enough. I can't afford my medications. I feel like my life will be cut short because of this.”
- “Disability benefits are well below the poverty line, and housing frequently costs well over 50% of benefit income. The most affordable housing is renting a room in someone's home. This isn't suitable for people with health issues like PTSD, anxiety, autism and sleep issues. People are very choosy about who they'll rent a room to, and many
landlords don't want you to have guests over.”
Analysis
Indicator 1: Percentage of people with disabilities who live in unaffordable housing
- People with disabilities are more likely to live in unaffordable housing compared to people without disabilities. In 2017, 44% of renters with disabilities spent more than 30% of their income on housing, compared to 32% of renters without disabilities. In 2019, these numbers were 43% for renters with disabilities and 29% for renters without disabilities. By 2022, the situation improved slightly, but a large gap remained – 34% of renters with disabilities still lived in unaffordable housing, compared to 25% of renters without disabilities (see figure 1).
- Renters with disabilities are almost three times as likely to live in unaffordable housing compared to owners. In 2017, 44.4% of renters with disabilities lived in unaffordable housing, compared to 15.6 % of owners with disabilities. In 2022, the numbers were 33.7% for renters with disabilities and 13.8% for owners with disabilities.
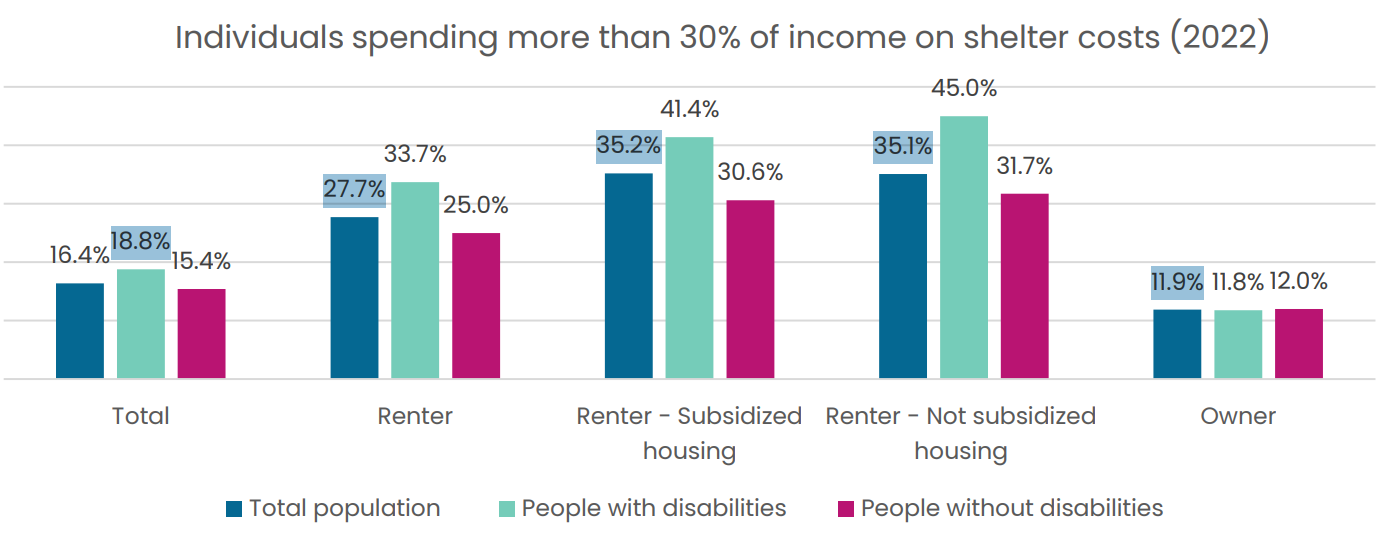
Figure 1 - Text version
| Total population | People with disabilities | People without disabilities | |
|---|---|---|---|
| Total | 16.4% | 18.8% | 15.4% |
| Renter | 27.7% | 33.7% | 25.0% |
| Renter - Subsidized housing | 35.2% | 41.4% | 30.6% |
| Renter - Not subsidized housing | 35.1% | 45.0% | 31.7% |
| Owner | 11.9% | 11.8% | 12.0% |
Indicator 2: Percentage of people with disabilities who couldn't pay their rent or their mortgage on time
- People with disabilities are more likely to skip or delay a housing payment, and more likely to miss housing payments due to financial difficulties. Based on 2021 data, one in ten people with disabilities (9.5% or 599,780 households) skipped or delayed a mortgage or rent payment in the last 12 months. This was compared to 6% of people without disabilities (527,610 households). About 91.9% of people with disabilities who skipped or delayed a housing payment said it was due to financial difficulties, compared with 88.5% of people without disabilities.
- Women with disabilities who are single parents were more than twice as likely to report skipping or delaying a mortgage or rent payment in the past 12 months (18%) compared to women without disabilities in the same household type (8%). Overall, households with dependents also showed higher rates of skipped or delayed payments, with 10% of
households without disabilities and 14% of households with disabilities reporting at least one missed housing payment in the past year.
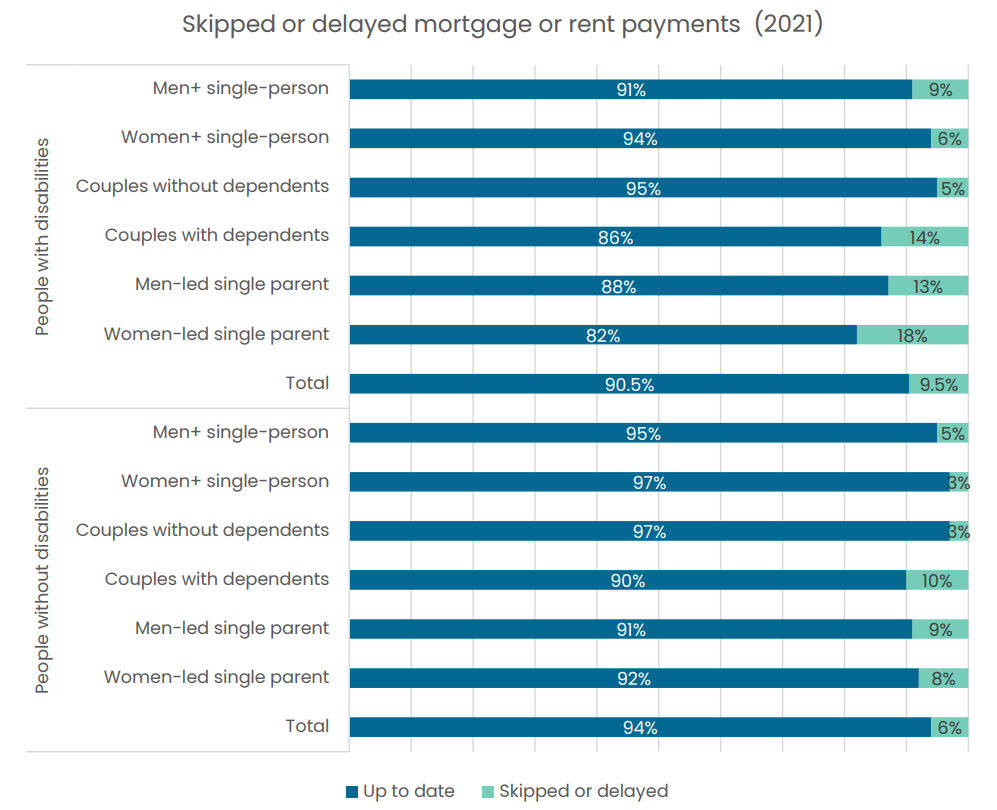
Figure 2 - Text version
| People with disabilities | Up to date | Skipped or delayed |
|---|---|---|
| Men+ single-person | 91% | 9% |
| Women+ single-person | 94% | 6% |
| Couples without dependents | 95% | 5% |
| Couples with dependents | 86% | 14% |
| Men-led single parent | 88% | 13% |
| Women-led single parent | 82% | 18% |
| Total | 90.5% | 9.5% |
| People without disabilities | Up to date | Skipped or delayed |
|---|---|---|
| Men+ single-person | 95% | 5% |
| Women+ single-person | 97% | 3% |
| Couples without dependents | 97% | 3% |
| Couples with dependents | 90% | 10% |
| Men-led single parent | 91% | 9% |
| Women-led single parent | 92% | 8% |
| Total | 94% | 6% |
Indicator 3: Percentage of people with disabilities who live in housing with subsidies
- People with disabilities are more likely to live in housing with subsidies than people without disabilities. People with disabilities continue to be significantly more likely to live in housing with subsidies compared to people without disabilities. In 2017, 5.4% of renters with disabilities (340,330 people) lived in housing with subsidies, compared to 2.1% of renters without disabilities (457,440 people). The 2022 data shows that this gap has persisted as 5.0% of persons with disabilities (401,350 people) lived in rental housing with subsidies, more than double the rate for persons without disabilities (2.0% or 440,090 people) (see figure 3).
- More than one in four women with disabilities who are single parents live in housing with subsidies (28%), compared to roughly one in six single mothers without disabilities (17%). Women with disabilities living alone also face higher rates of housing with subsidies use (21%) than women without disabilities in the same household type (11%). These gaps highlight the disproportionate economic vulnerability experienced by women with disabilities, particularly those supporting children or living on their own.
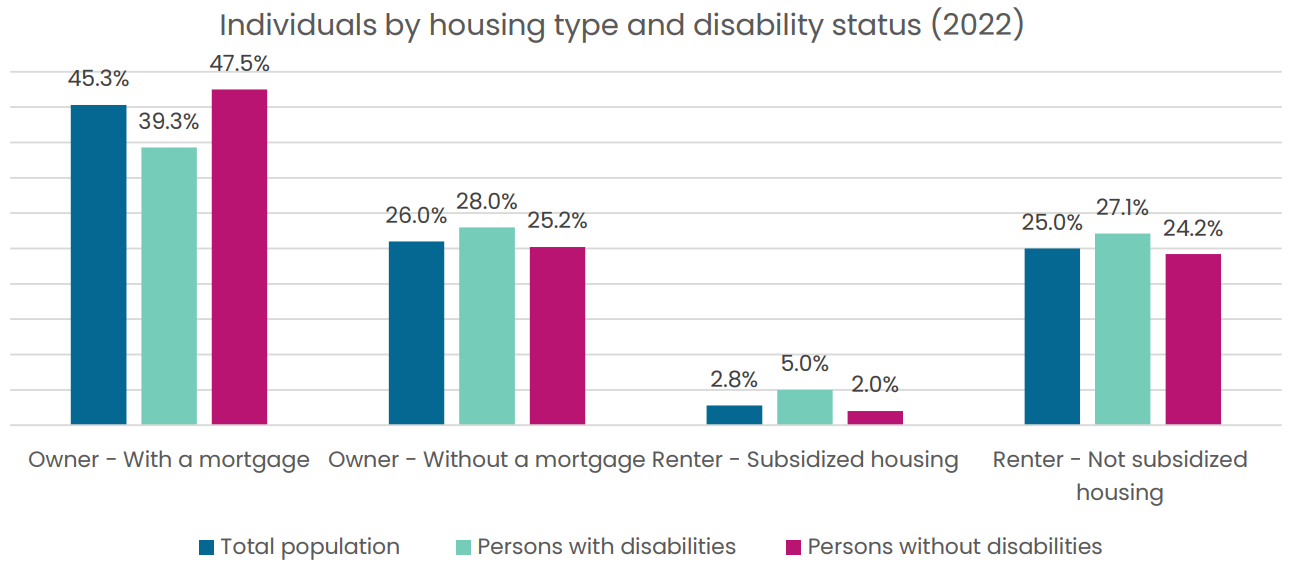
Figure 3 - Text version
| Total population | Persons with disabilities | Persons without disabilities | |
|---|---|---|---|
| Owner - With a mortgage | 45.3% | 39.3% | 47.5% |
| Owner - Without a mortgage | 26.0% | 28.0% | 25.2% |
| Renter - Subsidized housing | 2.8% | 5.0% | 2.0% |
| Renter - Not subsidized housing | 25.0% | 27.1% | 24.2% |
Indicator 4: Time that people with disabilities spent on waitlists for housing with subsidies
- People with disabilities are more likely to be on waitlists for social and affordable housing than people without disabilities. In 2021, 3% of people with disabilities were on these waitlists (155,120 households). This is compared to 1% of people without disabilities (72,740 households).
- People with disabilities without dependents spent longer on waitlists for social and affordable housing than people without disabilities without dependents. In 2021, the average wait time for those people with disabilities was 46 months. This is compared to 34 months for those people without disabilities.
- Indigenous people with disabilities are more likely to be on waitlists for housing with subsidies than Indigenous people without disabilities. In 2017, Indigenous people with disabilities were both more likely to be on waitlists for housing with subsidies and to wait longer than Indigenous people without disabilities. That year, 6% of Indigenous people with disabilities were on waitlists, compared to 3% of those without disabilities, and their average wait time was 42 months versus 28 months.
- Indigenous women with disabilities are more likely to be on waitlists for housing with subsidies than Indigenous men with disabilities. In 2017, 3.3% of Indigenous men and 4.9% of Indigenous women in Canada were on housing with subsidies waitlists. Among people with disabilities, Indigenous women with disabilities (6.2%) were slightly more likely to be on a waitlist than Indigenous men with disabilities (5.8%). The gender gap is even more pronounced among those without disabilities: 4.1% of Indigenous women without a disability were on waitlists, compared to 2.5% of Indigenous men without a disability.
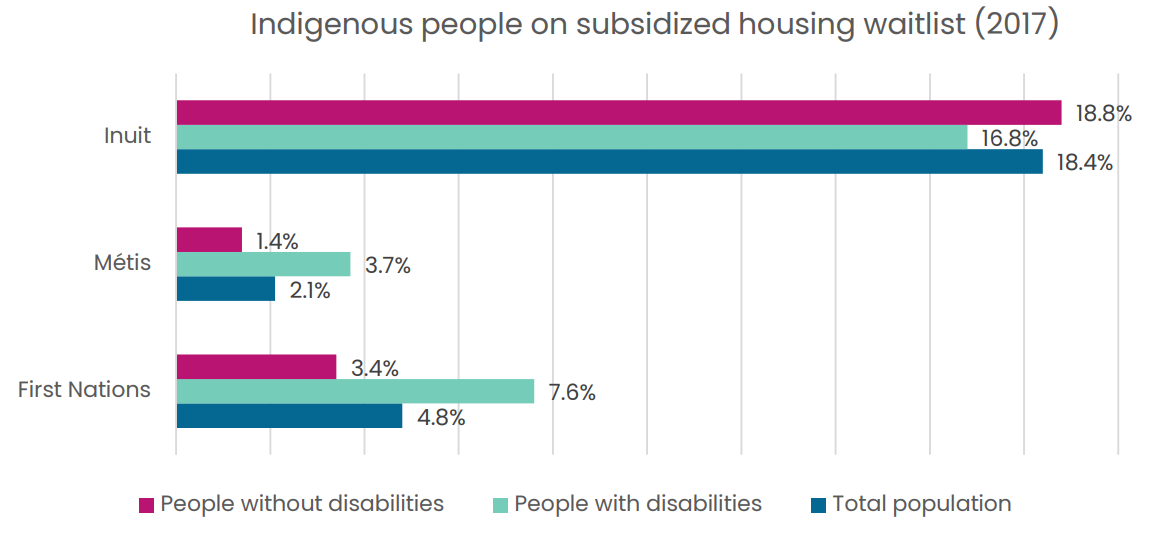
Figure 4 - Text version
| People without disabilities | People with disabilities | Total population | |
|---|---|---|---|
| First Nations | 18.8% | 16.8% | 18.4% |
| Métis | 1.4% | 3.7% | 2.1% |
| Inuit | 3.4% | 7.6% | 4.8% |
Indicateur 5 : Pourcentage de personnes en situation de handicap qui ne disposent pas d'un accès fiable à Internet à la maison
- People with disabilities are almost two times more likely to be in core housing need than people without disabilities. In 2017, 15.9% of people with disabilities (956,480 people) lived in core housing need. This was compared to 8.1% of people without disabilities (1,668,770 people). In 2022, 10.7% of people with disabilities (840,200 people) lived in core housing need. This was compared to 6.2% of people without disabilities (1,308,770 people).
- People with disabilities are more likely to live in core housing need than people without disabilities across a variety of housing types.In 2017, 33.6% of renters with disabilities were in core housing need, compared with 19.9% of renters without disabilities. This pattern persisted in 2019, with 31% for renters with disabilities and 17% for renters without disabilities and again in 2022, where 22.7% for renters with disabilities were in core housing need, compared with 14.1% for renters without disabilities. In that same year, 25.3% of people with disabilities in core housing need were living in housing with subsidies and 22.2% in market rental housing.
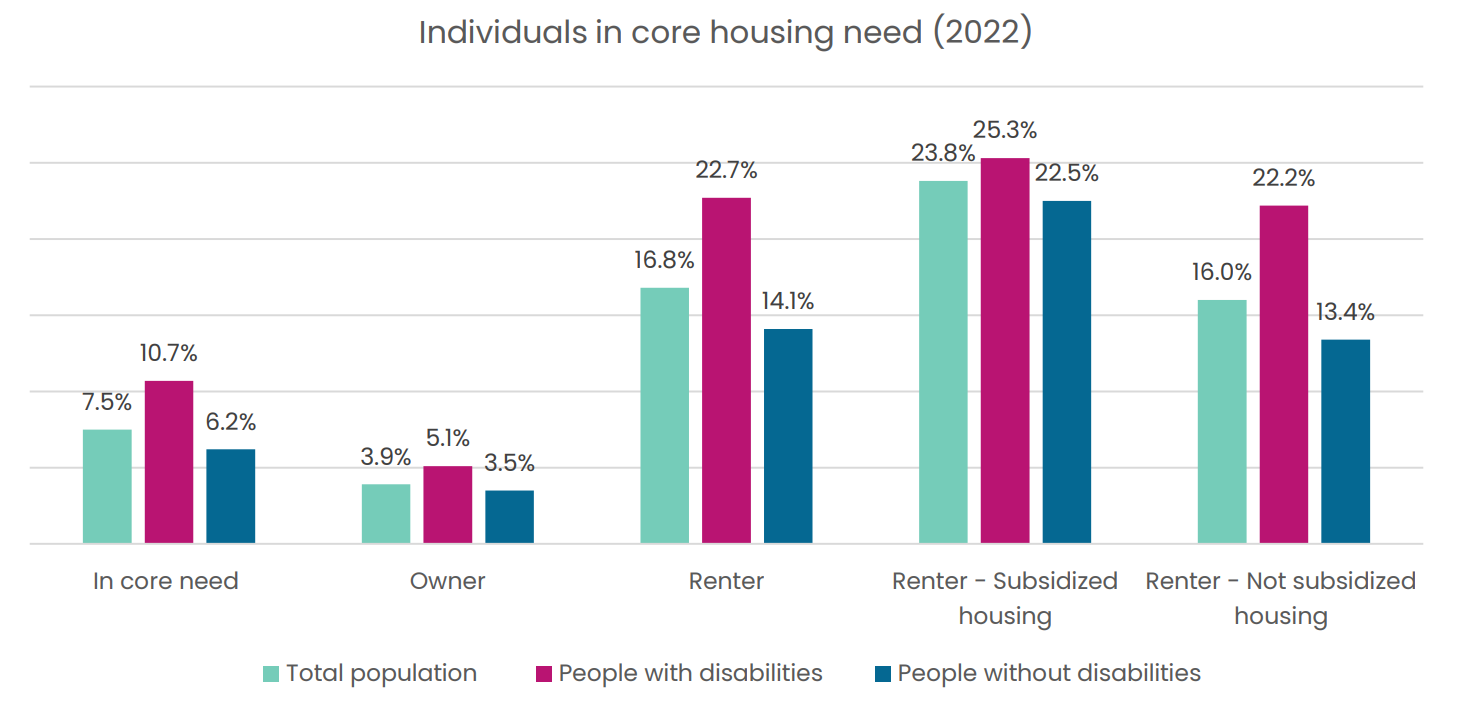
Figure 5 - Text version
| Total population | People with disabilities | People without disabilities | |
|---|---|---|---|
| In core need | 7.5% | 10.7% | 6.2% |
| Owner | 3.9% | 5.1% | 3.5% |
| Renter | 16.8% | 22.7% | 14.1% |
| Renter - Subsidized housing | 23.8% | 25.3% | 22.5% |
| Renter - Not subsidized housing | 16.0% | 22.2% | 13.4% |
For more information, see our fact sheet on core housing need.
Indicator 6: Cost difference between accessible and non-accessible housing
- Results: Not available. This data is not currently collected through national or provincial / territorial surveys. We are advocating for better data collection and transparency in this area.
Conclusion
In conclusion, people with disabilities face significant challenges when it comes to finding and keeping affordable housing in Canada. They are more likely than others to live in unaffordable homes, fall behind on rent or mortgage payments, and spend long periods waiting for housing with subsidies. Many live in fear of losing their homes or having to choose between paying for rent, food, or medication. These challenges are made worse by low disability benefits, rising housing costs, and a lack of accessible and affordable options. People told us that current supports are not enough to help them live independently and with dignity.
Read our report with recommendations to address these issues.