To view the full version and footnotes, please consult the PDF copy.
Introduction
The Canadian Human Rights Commission (CHRC) and the Office of the Federal Housing Advocate (OFHA) have legislated mandates to monitor human rights. Together, we are establishing a framework to monitor the right to adequate housing for people with disabilities in Canada. This framework helps to assess whether Canada is meeting its human rights obligations under Canadian and international laws, including the United Nations Convention on the Rights of Persons with Disabilities (CRPD) and the International Covenant on Economic, Social and Cultural Rights (ICESCR). Our work is designed to assist the Government of Canada in fulfilling its responsibility to monitor and report on its human rights obligations.
This monitoring framework tracks housing outcomes, policy efforts and government resources (i.e. spending) in the following eleven areas: institutionalization; homelessness; accessibility; the availability of supports and services; discrimination and dignity; affordability; security of tenure; safety; habitability; location; and cultural adequacy. You can find the indicators for all eleven areas on our website.
Habitability is a core element of the right to adequate housing. According to the United Nations, housing is not considered adequate if it does not guarantee physical safety or provide sufficient space, and if it fails to protect occupants from cold, damp, heat, rain, wind, structural risks, or other threats to health and well-being. Adequate housing should therefore ensure that people with disabilities are not forced to live in conditions that endanger their physical or mental health, expose them to environmental hazards, or prevent them from living in dignity.
We are creating a baseline of results that can be updated as new data becomes available and to help measure progress. We use a variety of data sources to track outcomes, since no single source captures the lived experiences of all people with disabilities in Canada. We also recognize that there are gaps in the data being collected at the time of writing this report. We primarily drew on data from the Canadian Survey on Disability (CSD) from 2017 and 2022 and the Canadian Housing Survey (CHS) from 2021. These two surveys use the social model of disability to identify people with disabilities.
For this report, we also relied on the Canadian Income Survey (CIS) from 2019. The CSD and the CIS identify people with disabilities in different ways. Because their populations, sampling frames, and disability measures differ, results from these two surveys should not be directly compared. We disaggregated data to the greatest extent possible, applying an intersectional approach, but due to data gaps we were unable to disaggregate fully. Notable results for particular intersections of identities were included when the data was available.
What people told us
- “My front door doesn't lock. The furnace is broken, and the oven doesn't work. The landlord said we will be evicted if we ask for repairs. We can't afford to live anywhere else.”
- “All I can afford is a room that has cockroaches and bedbugs. Waitlists for housing with subsidies and co-ops have been full for years.”
Analysis
Indicator 1: Percentage of people with disabilities who aren’t satisfied with the amount of space in their home
- People with disabilities are less likely to be satisfied with having enough space in their homes compared to people without disabilities. Overall, only 74.4% of people with disabilities are satisfied with the space in their home (4,697,710 households), compared to 80.3% of people without disabilities (7,019,690 households) (see figure 1).
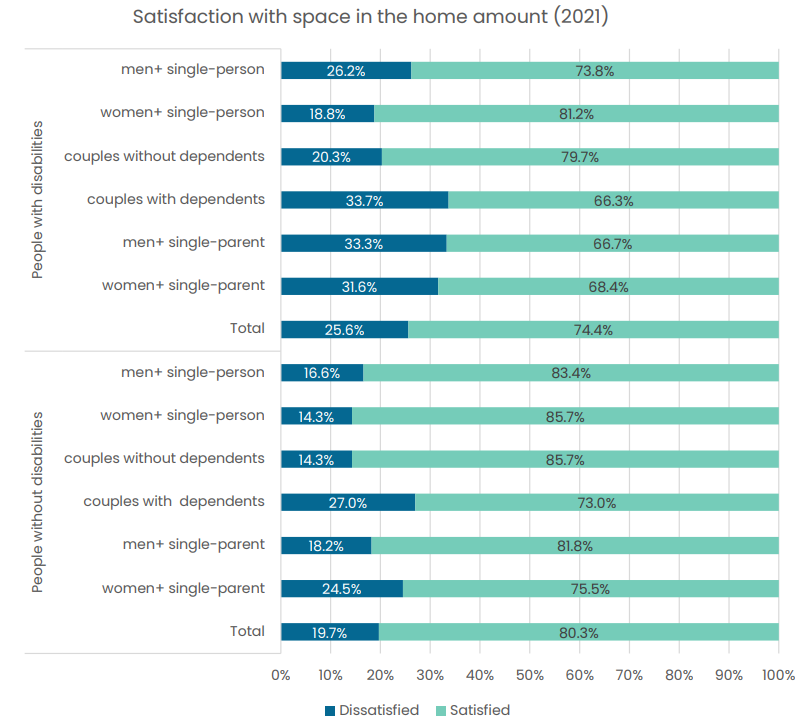
Figure 1 - Text version
| People with disabilities | Dissatisfied | Satisfied |
|---|---|---|
| men+ single-person | 26.2% | 73.8% |
| women+ single-person | 18.8% | 81.2% |
| couples without dependents | 20.3% | 79.7% |
| couples with dependents | 33.7% | 66.3% |
| men+ single-parent | 33.3% | 66.7% |
| women+ single-parent | 31.6% | 68.4% |
| Total | 25.6% | 74.4% |
| People without disabilities | Dissatisfied | Satisfied |
|---|---|---|
| men+ single-person | 16.6% | 83.4% |
| women+ single-person | 14.3% | 85.7% |
| couples without dependents | 14.3% | 85.7% |
| couples with dependents | 27.0% | 73.0% |
| men+ single-parent | 18.2% | 81.8% |
| women+ single-parent | 24.5% | 75.5% |
| Total | 19.7% | 80.3% |
Indicator 2: Percentage of people with disabilities living in overcrowded homes
- People with disabilities are less likely to live in overcrowded housing compared to people without disabilities. This trend is consistent for owners, renters and renters in housing with subsidies. In 2017, 5.9% of people with disabilities (368,720 people) and 8.1% of people without disabilities (1,772,870 people) were living in overcrowded housing overall. Among renters, 10.4% of people with disabilities (211,710 people) and 16.9% of people without disabilities (915,740 people) lived in overcrowded housing, while among those in housing with subsidies 7.2% of people with disabilities (24,530 people) and 20.8% of people without disabilities (95,280 people) lived in overcrowded conditions.
In 2022, the same pattern was observed – 6% of people with disabilities (482,340 people) lived in overcrowded housing compared to 9.4% of people without disabilities (2,028,000
people). Among renters, 10.1% of people with disabilities (260,210 people) and 19.1% of people without disabilities (1,081,660 people) lived in overcrowded housing. The gap is even larger among renters in housing with subsidies, where 10.2% of people with disabilities and 24.8% of people without disabilities were living in overcrowded conditions (see figure 2).
Note: This data may appear unexpected. It reflects the fact that people with disabilities are more likely to live alone or in smaller household sizes, often because of life-course factors such as reduced employment, limited family formation, or the need for independence and privacy for disability-related reasons.
- Gender gaps among people with disabilities living in overcrowded housing are relatively small overall but vary by housing type. In 2017, women with disabilities were slightly more likely to live in overcrowded housing, with 6.5% of women with disabilities (226,420 people) compared to 5.1% of men (142,290 people). Among renters, 11% of women with disabilities (131,340 people) and 9.6% of men with disabilities (80,370 people) lived in overcrowded conditions. For people living in housing with subsidies, 7.7% of women with disabilities were unsuitably housed compared to 6.5% of men with disabilities (see figure 3).
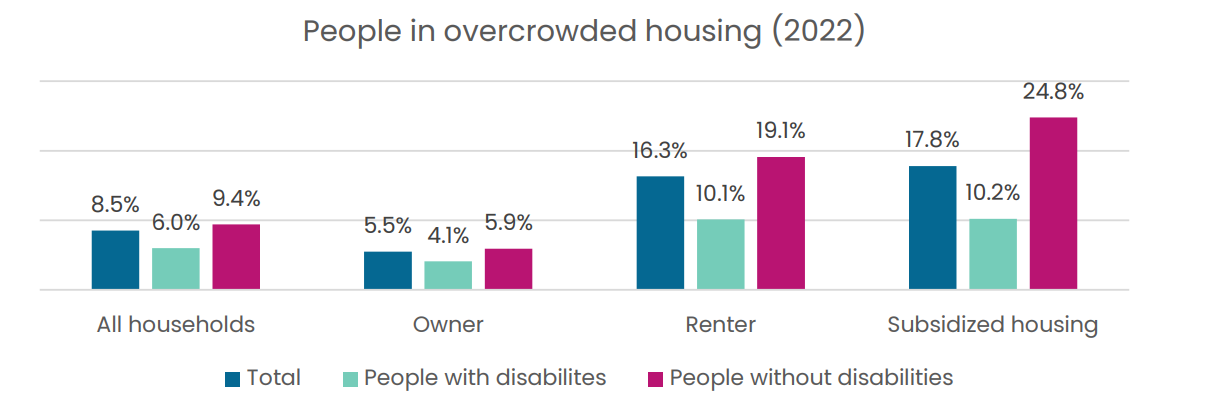
Figure 2 - Text version
| Total | People with disabilites | People without disabilities | |
|---|---|---|---|
| All households | 8.5% | 6.0% | 9.4% |
| Owner | 5.5% | 4.1% | 5.9% |
| Renter | 16.3% | 10.1% | 19.1% |
| Subsidized housing | 17.8% | 10.2% | 24.8% |
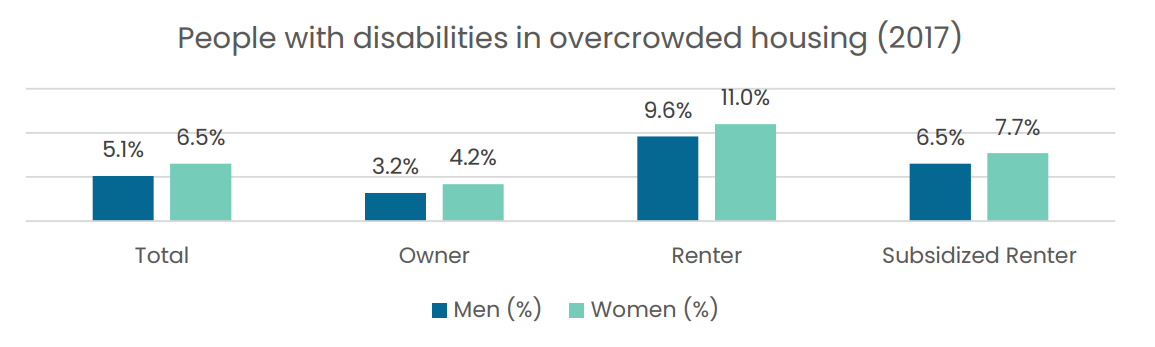
Figure 3 - text version
| Men (%) | Women (%) | |
|---|---|---|
| Total | 5.1% | 6.5% |
| Owner | 3.2% | 4.2% |
| Renter | 9.6% | 11.0% |
| Subsidized Renter | 6.5% | 7.7% |
In 2022, women with disabilities were slightly more likely to live in overcrowded housing, at 6.4% of women with disabilities (287,610 people) compared to 5.6% of men (194,730
people). Among renters, 10.7% of women with disabilities (160,540 people) and 9.4% of men with disabilities (99,670 people) lived in overcrowded housing (see Figure 4).
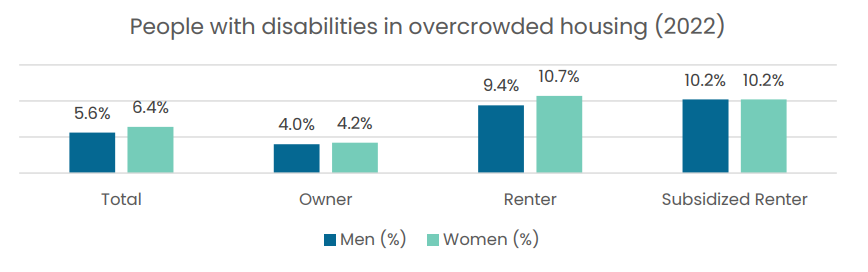
Figure 4 - text version
| Men (%) | Women (%) | |
|---|---|---|
| Total | 5.6% | 6.4% |
| Owner | 4.0% | 4.2% |
| Renter | 9.4% | 10.7% |
| Subsidized Renter | 10.2% | 10.2% |
Indicator 3: Percentage of people with disabilities who had issues with mould or mildew at home
- People with disabilities are twice as likely to report having issues with mould in the last 12 months, compared to people without disabilities. 6.9% of people with disabilities (433,900 households) reported issues with mould, compared to just 3.2% of people without disabilities (286,520 households). When looking at different household types (see figure 5), a greater proportion of households that included a person or dependents with a disability reported issues with mould or mildew in the past 12 months.
- 12.1% of Indigenous men (4,780) and 16% of Indigenous women (9,810) cite the presence of mould or mildew at home as a reason of housing dissatisfaction. For people with disabilities, the gender gap is larger – 11% of Indigenous men with disabilities (1,800) and 17.1% of Indigenous women with disabilities (5,360) cite presence of mould or mildew at home as a reason of housing dissatisfaction. Among people without disabilities, 12.9% of Indigenous men (2,970) and 14.9% of Indigenous women (4,450) cite this reason for housing dissatisfaction.
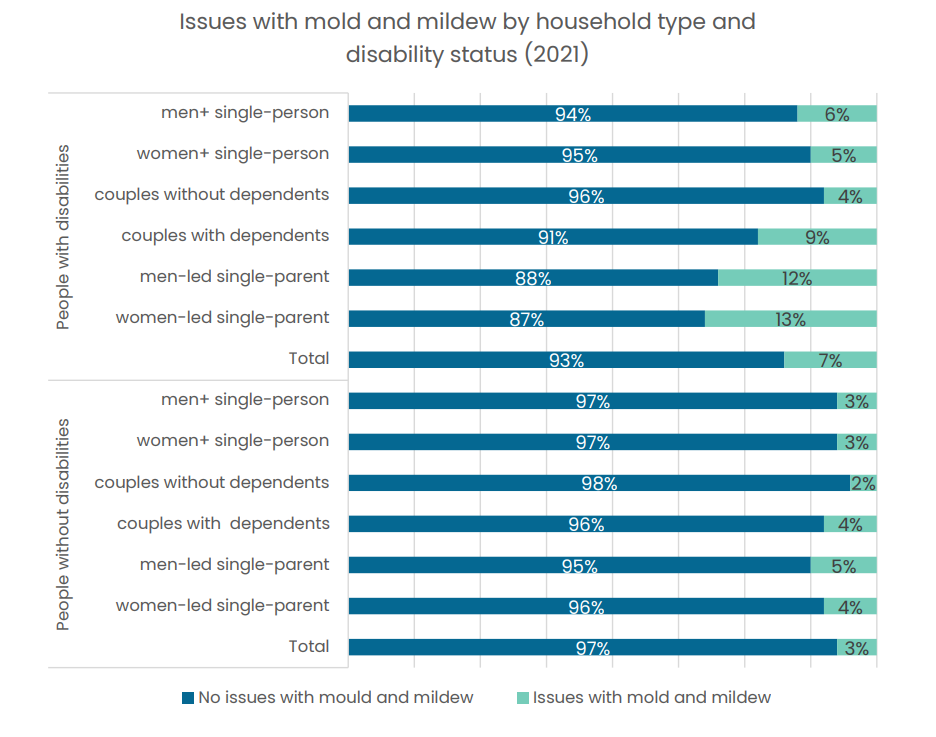
Figure 5 - text version
| People with disabilities | No issues with mould and mildew | Issues with mold and mildew |
|---|---|---|
| men+ single-person | 94% | 6% |
| women+ single-person | 95% | 5% |
| couples without dependents | 96% | 4% |
| couples with dependents | 91% | 9% |
| men-led single-parent | 88% | 12% |
| women-led single-parent | 87% | 13% |
| Total | 93% | 7% |
| People without disabilities | No issues with mould and mildew | Issues with mold and mildew |
|---|---|---|
| men+ single-person | 97% | 3% |
| women+ single-person | 97% | 3% |
| couples without dependents | 98% | 2% |
| couples with dependents | 96% | 4% |
| men-led single-parent | 95% | 5% |
| women-led single-parent | 96% | 4% |
| Total | 97% | 3% |
Indicator 4: Percentage of people with disabilities who had pest infestations in their homes
- Almost 1 in 5 households with people with disabilities (18.3% or 1,153,970 households) had experienced a pest infestation in the past 12 months. Among households without people with disabilities, the percentage is lower at 11.2% (978,100 households). Certain types of households with people with disabilities are also more impacted by pest infestations, including single-person households (7.1% for people with disabilities compared to 3.6% for people without disabilities), couples without dependents (3.7% compared to 2.2%) and women-led single-parent households (1.8% compared to 0.7%).
Indicator 5: Percentage of people with disabilities whose homes need minor repairs
- In 2021, over 1 in 4 people with disabilities (27.9% or 1,765,970 households) report that their home is in need of minor repairs. This is compared to just 1 in 5 households that do not include people with disabilities (19.9% or 1,744,280 households) that report that their home is in need of minor repairs. A similar proportion of renters and owners reported that their housing needed minor repairs (see figure 6).
- Almost 1 in 3 Indigenous people with a disability (31.3% or 18,570) live in housing in need of minor repairs, compared to 1 in 4 Indigenous people without a disability (26.4% or 34,090). Looking more closely at Indigenous people with a disability and a single-identity as either First Nations, Inuit or Metis – 30.2% of First Nations people (10,090), 32.9% of Metis people (7,800), and 28.7% of Inuit people (360) report that their home is in need of minor repairs (see figure 7).
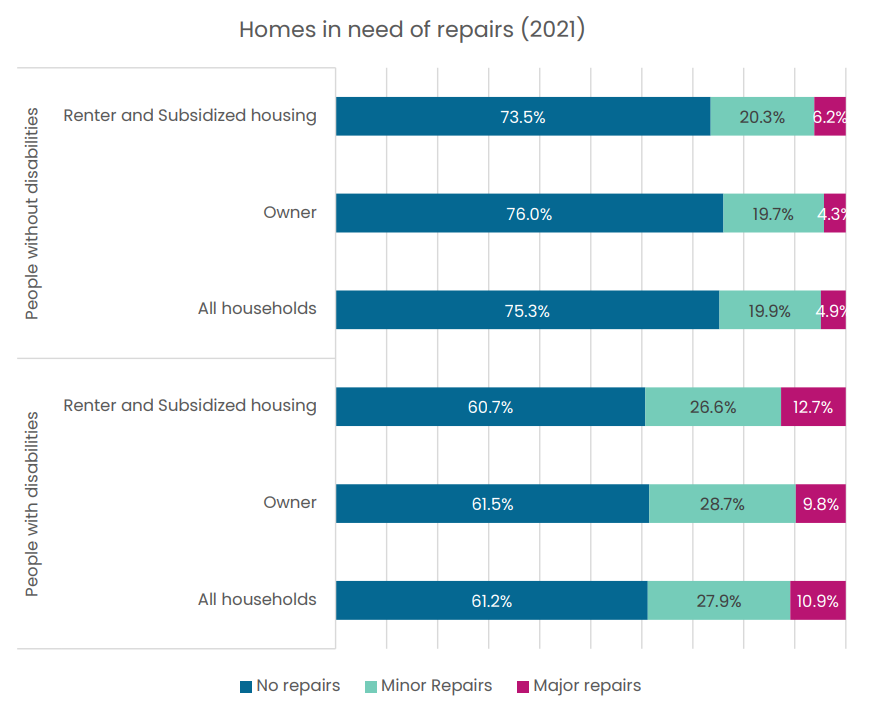
Figure 6 - text version
| People without disabilities | No repairs | Minor Repairs | Major repairs |
|---|---|---|---|
| Renter and Subsidized housing | 73.5% | 20.3% | 6.2% |
| Owner | 76.0% | 19.7% | 4.3% |
| All households | 75.3% | 19.9% | 4.9% |
| People with disabilities | No repairs | Minor Repairs | Major repairs |
|---|---|---|---|
| Renter and Subsidized housing | 60.7% | 26.6% | 12.7% |
| Owner | 61.5% | 28.7% | 9.8% |
| All households | 61.2% | 27.9% | 10.9% |
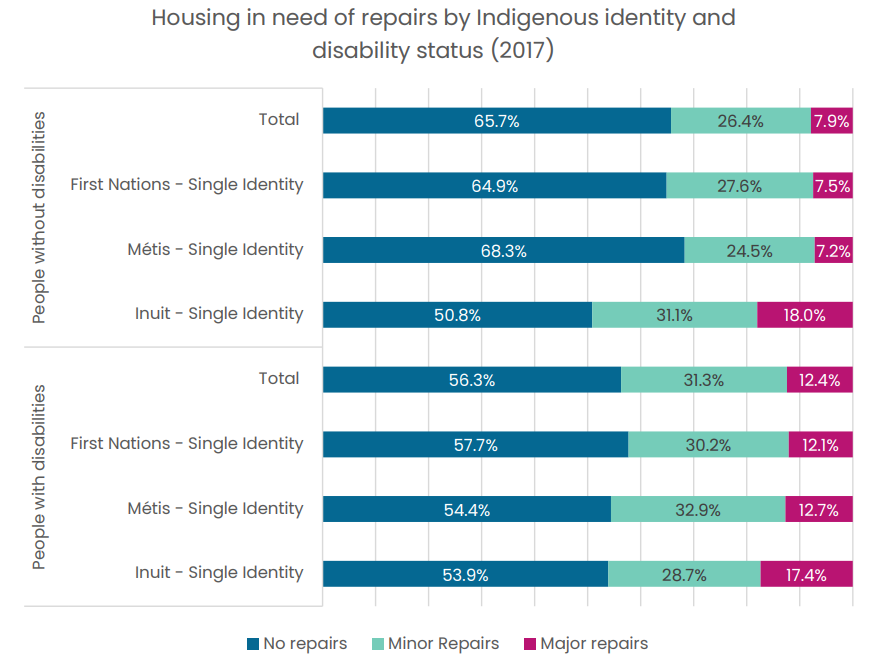
Figure 7 - text version
| People without disabilities | No repairs | Minor Repairs | Major repairs |
|---|---|---|---|
| Total | 65.7% | 26.4% | 7.9% |
| First Nations - Single Identity | 64.9% | 27.6% | 7.5% |
| Métis - Single Identity | 68.3% | 24.5% | 7.2% |
| Inuit - Single Identity | 50.8% | 31.1% | 18.0% |
| People with disabilities | No repairs | Minor Repairs | Major repairs |
|---|---|---|---|
| Total | 56.3% | 31.3% | 12.4% |
| First Nations - Single Identity | 57.7% | 30.2% | 12.1% |
| Métis - Single Identity | 54.4% | 32.9% | 12.7% |
| Inuit - Single Identity | 53.9% | 28.7% | 17.4% |
Indicator 6: Percentage of people with disabilities whose homes need major repairs
- In 2022, almost one in ten people with disabilities (9% or 717,490 people) live in housing in need of major repairs, compared to just around one in twenty people without disabilities (6% or 1,051,010). People with disabilities consistently face a higher need for major repairs across all housing types compared to people without disabilities, except for in housing with subsidies (see figure 8). The percentage of people living in housing in need of major repairs has not changed that much from 2017 (see figure 9), although a greater percentage of people with disabilities that live in rental housing and housing with subsidies reported that their housing was in need of major repairs in 2017 compared to 2022. This data highlights the challenges faced by people with disabilities attaining well-maintained dwellings, relative to their non-disabled counterparts.
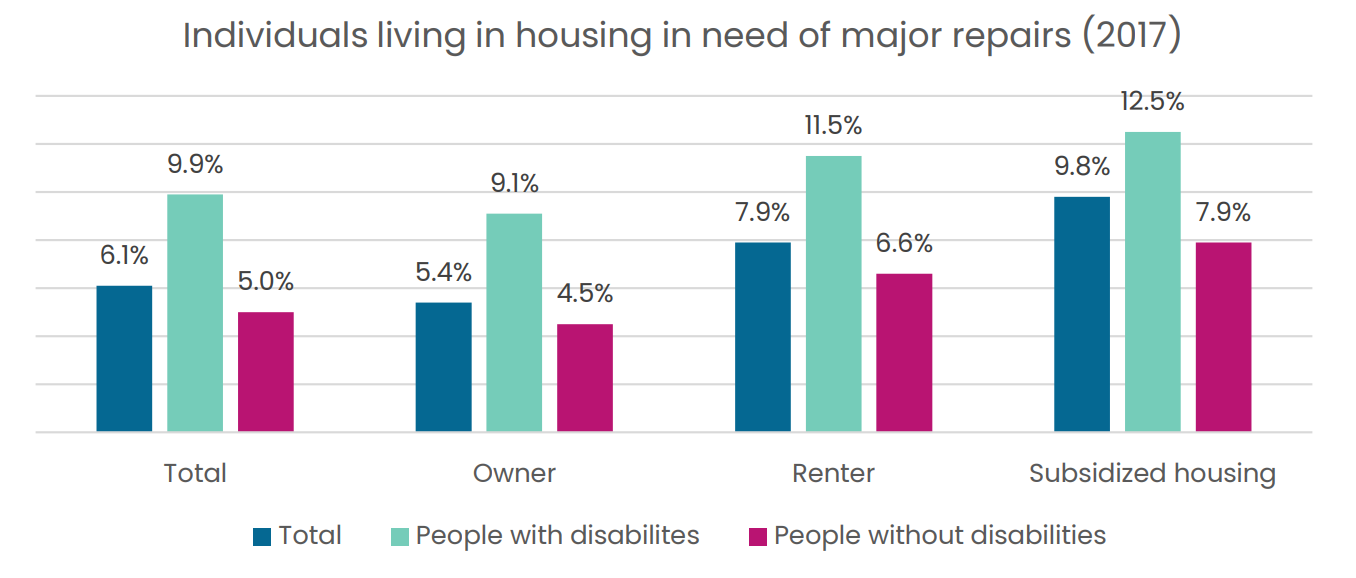
Figure 8 - text version
| Total | People with disabilites | People without disabilities | |
|---|---|---|---|
| Total | 6.1% | 9.9% | 5.0% |
| Owner | 5.4% | 9.1% | 4.5% |
| Renter | 7.9% | 11.5% | 6.6% |
| Subsidized housing | 9.8% | 12.5% | 7.9% |
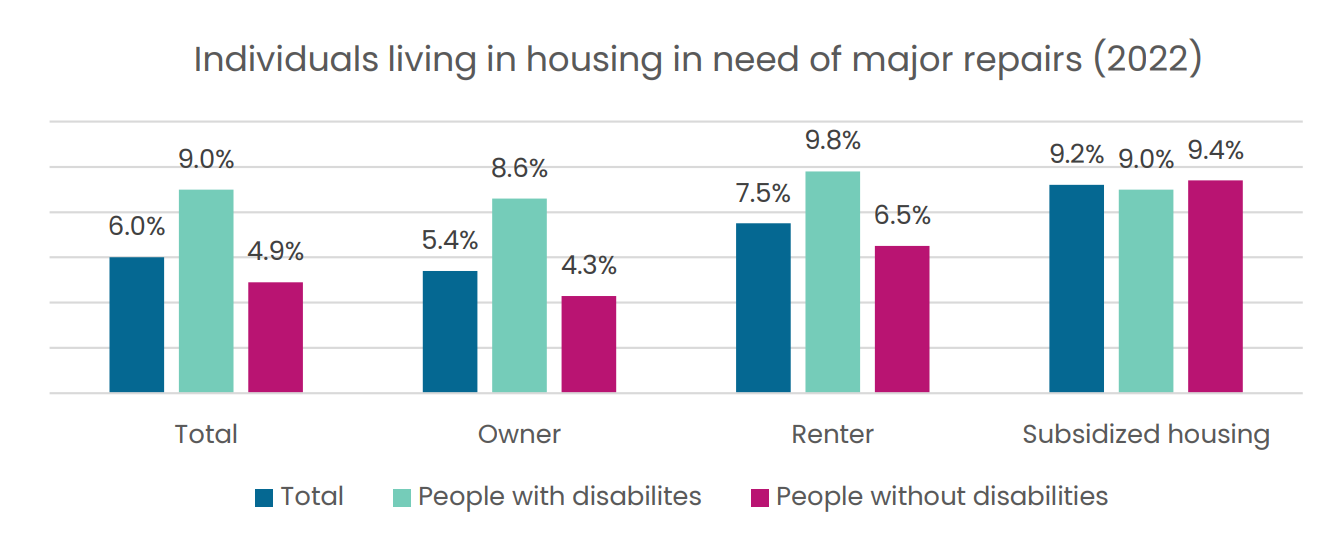
Figure 9 - text version
| Total | People with disabilites | People without disabilities | |
|---|---|---|---|
| Total | 6.0% | 9.0% | 4.9% |
| Owner | 5.4% | 8.6% | 4.3% |
| Renter | 7.5% | 9.8% | 6.5% |
| Subsidized housing | 9.2% | 9.0% | 9.4% |
Indicator 7: Percentage of renters with disabilities who paid for house repairs and pest control
Conclusion
In conclusion, people with disabilities report consistently lower satisfaction with the amount of space in their homes. Gender differences within this group are generally small but vary by housing type, with women with disabilities persistently more likely to live in overcrowded conditions in both 2017 and 2022. Similarly, among renters and those in housing with subsidies, women with disabilities face higher rates of unsuitable or overcrowded housing than men with disabilities. People with disabilities are also more likely to encounter environmental challenges in their homes, including higher rates of reported mould and pest infestations. Housing repair needs are more common among people with disabilities, who are more likely to live in homes requiring both minor and major repairs. These issues are even more pronounced for Indigenous people with disabilities, who experience higher rates of minor repair needs and mould-related dissatisfaction compared to Indigenous people without disabilities. Overall, the results based on the available data show persistent and significant housing-related barriers affecting people with disabilities. These results highlight the critical need for targeted housing policies that address the unique challenges faced by people with disabilities, especially among single parents, Indigenous communities, and low-income households.
Read our report with recommendations to address these issues.