To view the full version and footnotes, please consult the PDF copy.
Introduction
The Canadian Human Rights Commission (CHRC) and the Office of the Federal Housing Advocate (OFHA) have legislated mandates to monitor human rights. Together, we are establishing a framework to monitor the right to adequate housing for people with disabilities in Canada. This framework helps to assess whether Canada is meeting its human rights obligations under Canadian and international laws, including the United Nations Convention on the Rights of
Persons with Disabilities (CRPD) and the International Covenant on Economic, Social and Cultural Rights (ICESCR). Our work is designed to assist the Government of Canada in fulfilling its responsibility to monitor and report on its human rights obligations.
This monitoring framework tracks housing outcomes, policy efforts and government resources (i.e., spending) in the following eleven areas: institutionalization; homelessness; accessibility; the availability of supports and services; discrimination and dignity; affordability; security of
tenure; safety; habitability; location; and cultural adequacy. You can find the indicators for all eleven areas on our website. This report presents the results for the outcome indicators on
homelessness.
Homelessness is a serious violation of the right to adequate housing. It occurs when people do not have a stable, safe, and permanent place to live. Homelessness can be visible, such as sleeping outside or in shelters, or hidden, such as temporarily staying with friends or family without secure housing. For many people with disabilities, their risk of becoming homeless is shaped by barriers like poverty, inaccessible housing, and the lack of appropriate supports and services.
We are creating a baseline of results that can be updated as new data becomes available and to help measure progress. We use a variety of data sources to track outcomes, since no single source captures the lived experiences of all people with disabilities in Canada. We also recognize that there are gaps in the data being collected at the time of writing this report. We primarily drew on data from the Canadian Survey on Disability (CSD) from 2017 and 2022 and the Canadian Housing Survey (CHS) from 2021. These two surveys use the social model of disability to identify people with disabilities.3 We disaggregated data to the greatest extent possible, applying an intersectional approach, but due to data gaps we were unable to disaggregate fully. Notable results for particular intersections of identities were included when the data was available.
What people told us
People with disabilities told us they experienced homelessness because they lived in poverty, they could not work and they could not survive on their disability benefits.
- “When you're homeless, every day is a struggle. It's a struggle to meet basic needs like staying warm, dry, and fed. We are shunned, displaced, and harassed. We don't have security, heat, a shower, or a toilet. We don't have privacy or stability. We get robbed and abused. Police and bylaw officers criminalize us. They make us move. This is making my PTSD and health problems worse.”
- “I moved in with family members after leaving an abusive relationship. Shelters seem unsafe and unhealthy. Staying at a shelter would have a negative impact on my mental and physical health.”
- “I'm disabled, homeless and hungry all the time. I can't think about anything else.”
Analysis
Indicator 1: Experiences of homelessness for people with disabilities
- People with disabilities are more than twice as likely to experience hidden homelessness. In 2021, about 1,023,330 people with disabilities (16.2%) said they had experienced hidden homelessness. This was compared to 564,310 people without disabilities (6.5%).
- People with disabilities are nearly four times more likely to experience homelessness than people without disabilities. In 2021, about 3.9% of people with disabilities (244,580 people) said they had experienced homelessness in their lifetime. This was compared to only 1.1% of people without disabilities (91,520).
Indicator 2: Percentage of people with disabilities in homeless shelters who feel that shelters and services meet their needs
- Results: Not available. This data is not currently collected through national or provincial / territorial surveys. We are advocating for better data collection and transparency in this area.
Indicator 3: Duration of homelessness
- People with disabilities experience chronic and temporary hidden homelessness for longer periods of time than people without disabilities.
- Chronic hidden homelessness: 35.8% of people with disabilities who experienced hidden homelessness (363,960 people) said their longest period of homelessness was more than 6 months. This is compared to 29.2% of people without disabilities who experienced hidden homelessness (164,460 people).
- Temporary hidden homelessness: 64.2% of people with disabilities who experienced hidden homelessness (651,940 people) said their longest period of homelessness was less than 6 months. This is compared to 70.8% of people without disabilities who experienced homelessness (398,820 people).
- Among the 117,920 people who had experienced homelessness for more than six months, more than twice as many were people with disabilities (87,250 people) compared to people without disabilities (30,670 people) (see figure 1). However, the proportion of people who experienced homelessness for more than six months was relatively similar for the two groups – 36.2% of people with disabilities reported that their longest period of homelessness was more than six months, compared to 33.8% of people without disabilities (see figure 2).
Figure 1: Length of longest homelessness experience (<6 months vs. 6+ months) by disability status, CHS 2021 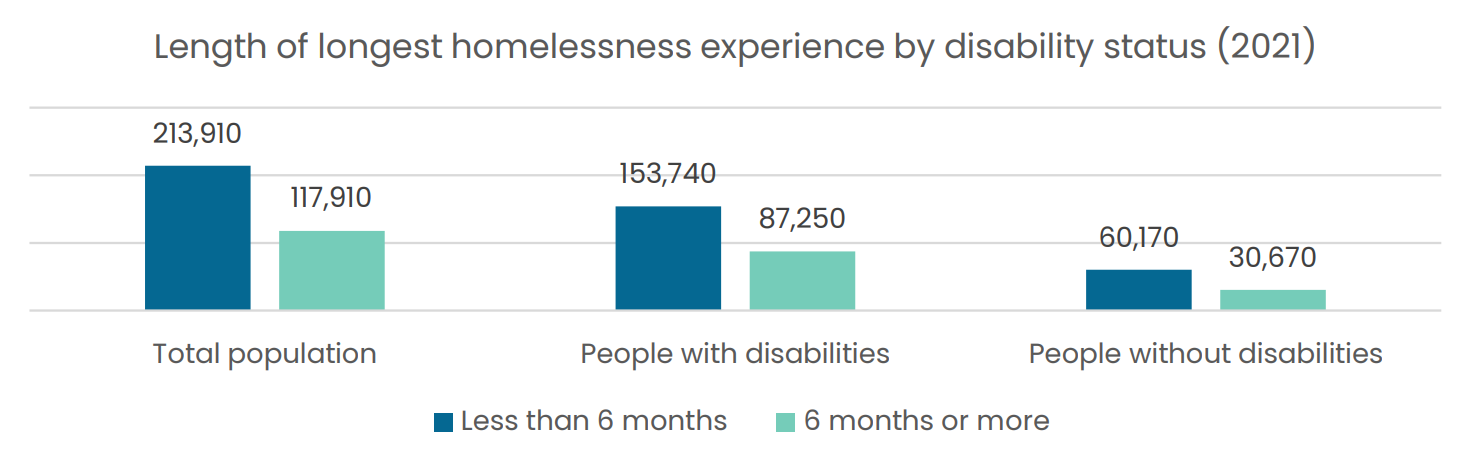
Figure 1 - Text version
Length of longest homelessness experience by disability status (2021) Less than 6 months 6 months or more Total population 213,910 117,910 People with disabilities 153,740 87,250 People without disabilities 60,170 30,670 Figure 2: Length of longest homelessness experience (% within each group who experienced homelessness) by disability status, CHS 2021 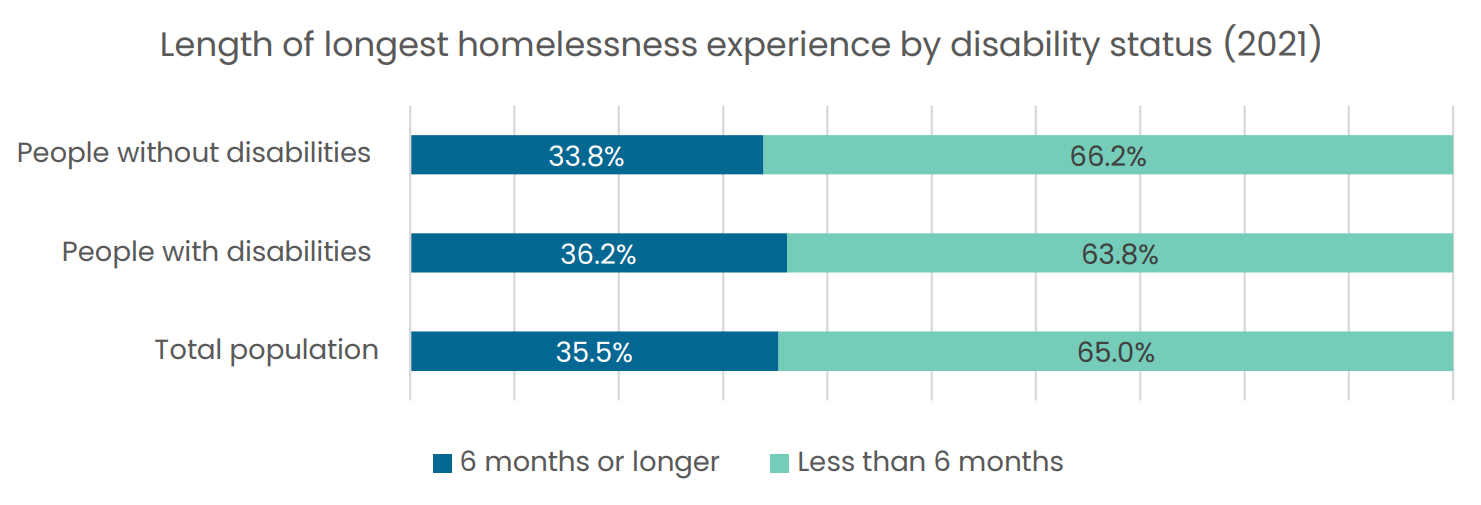
Figure 2 - Text version
Length of longest homelessness experience by disability status (2021) 6 months or longer Less than 6 months People without disabilities 33.8% 66.2% People with disabilities 36.2% 63.8% Total population 35.5% 65.0% - Among the 528,420 people who have experienced chronic hidden homelessness, more than twice as many were people with disabilities (363,960 people), compared to people without disabilities (164,460 people) (see figure 3). Among people who experienced hidden homelessness in their lifetime, 33.5% of people stayed with someone else for 6 months or more (528,420 people). The percentage of people with disabilities who stayed with someone for 6 months or longer was higher at 35.8% (363,960 people), compared to people without disabilities at 29.2% (164,460 people).
Figure 3: Length of longest hidden homelessness experience (<6 months vs. 6+ months) by disability status, CHS 2021 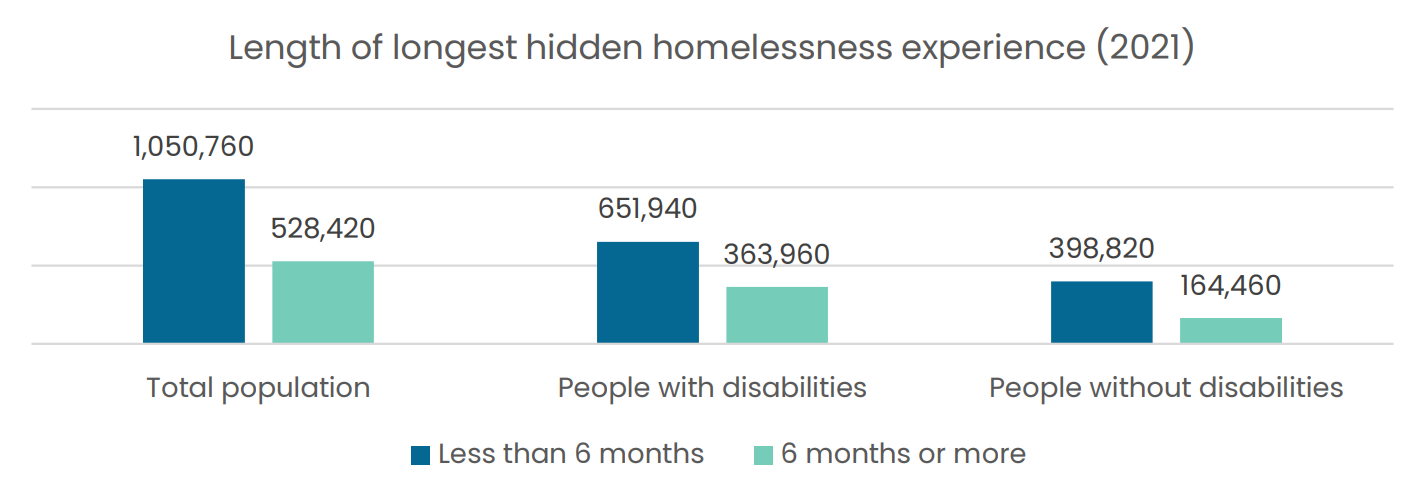
Figure 3 - Text version
Length of longest hidden homelessness experience (2021) Less than 6 months 6 months or more Total population 1,050,760 528,420 People with disabilities 651,940 363,960 People without disabilities 398,820 164,460 Figure 4: Length of longest hidden homelessness experience (% within each group who experienced homelessness), by disability status, CHS 2021 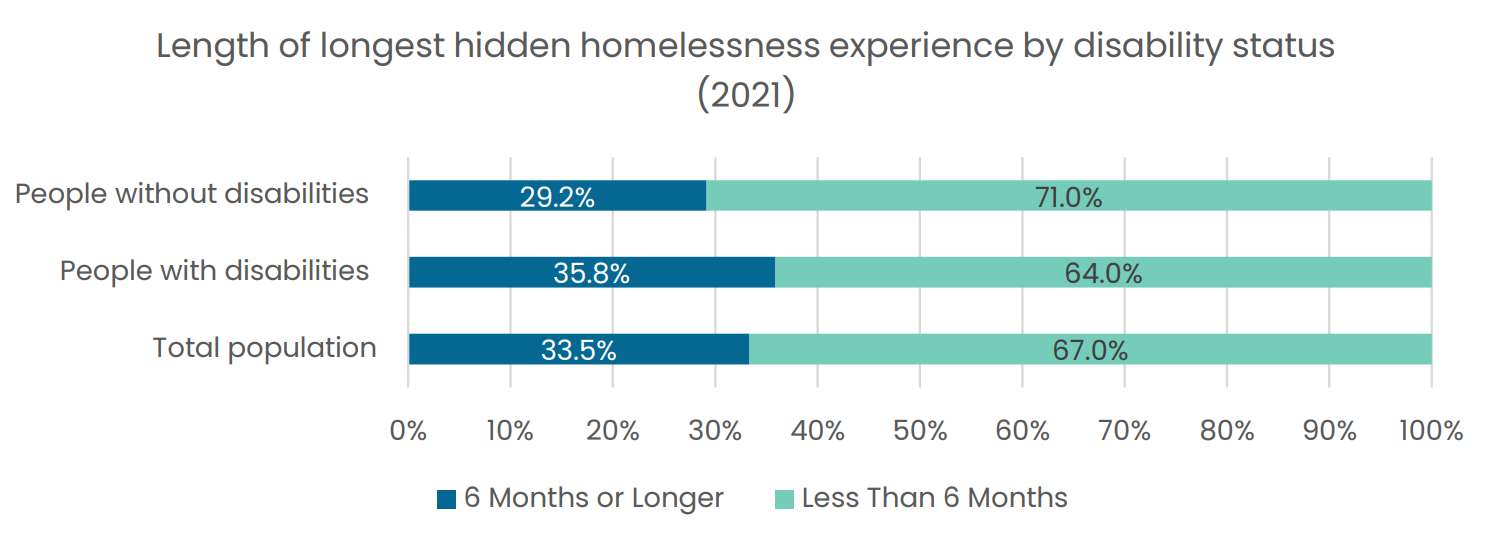
Figure 4 - Text version
Length of longest hidden homelessness experience by disability status (2021) 6 Months or Longer Less Than 6 Months People without disabilities 29.2% 71.0% People with disabilities 35.8% 64.0% Total population 33.5% 67.0%
Indicator 4: Reasons for homelessness
- Almost three times as many people with disabilities reported that economic issues contributed to their most recent experience of homelessness. Of the people with disabilities who experienced homelessness, 108,140 reported that economic issues contributed to their most recent experience of homelessness (44.9%), compared to 36,190 people without disabilities (40.1%).
- More than four times as many people with disabilities reported that relationship breakdown contributed to their most recent experience of homelessness. Among people with disabilities who experienced homelessness, 111,260 reported that relationship breakdown contributed to their most recent experience of homelessness (46.9%), compared to 27,380 people without disabilities (30.4%).
- People with disabilities are more than twice as likely to report that their most recent experience of homelessness was due to health issues, compared to people without disabilities. Among people with disabilities who experienced homelessness, approximately 47,370 (19.7%) reported that their most recent experience of homelessness was due to health issues, compared to just 8,010 (8.9%) of people without disabilities (see figure 5).
Figure 5: Situations contributing to people's most recent experience of homelessness, by disability status, CHS 2021 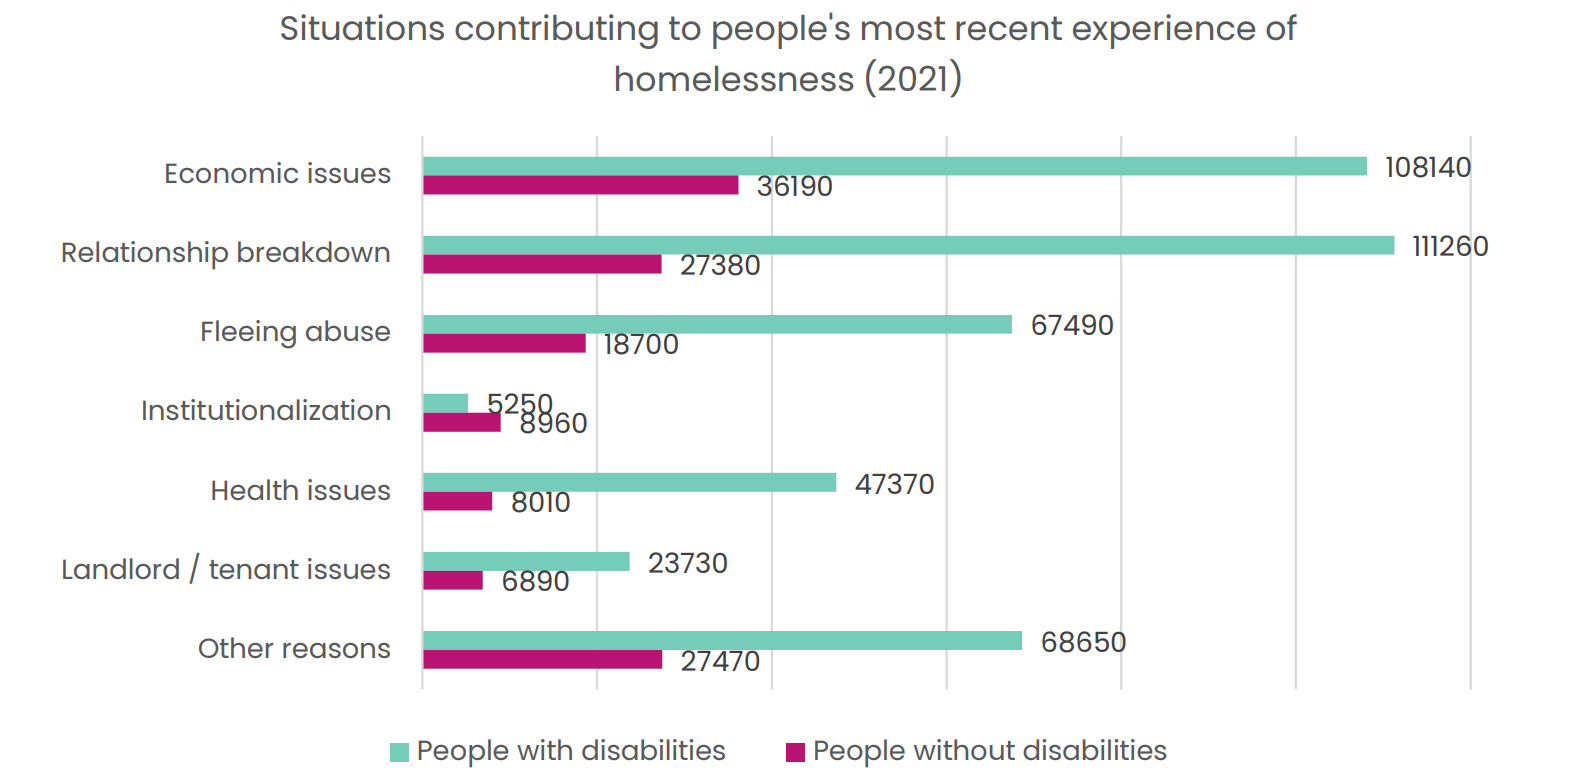
Figure 5 - Text version
Situations contributing to people's most recent experience of homelessness (2021) People with disabilities People without disabilities Economic issues 108,140 36,190 Relationship breakdown 111,260 27,380 Fleeing abuse 67,490 18,700 Institutionalization 5,250 8,960 Health issues 47,370 8,010 Landlord / tenant issues 23,730 6,890 Other reasons 68,650 27,470
Indicator 5: Number of people with disabilities who have experienced homelessness but who now have acceptable housing
- Less than half of people with disabilities that experienced homelessness now live in acceptable housing. 46.1% of all people who experienced homelessness are now in acceptable housing (154,920 people). Among people with disabilities who also experienced homelessness (244,580 people), the percentage is lower for those now in acceptable housing at 43.7% (106,900 people). Among people without disabilities who also experienced homelessness (91,520 people), the percentage is higher for those now in acceptable housing at 52.5% (48,020 people) (see figure 6).
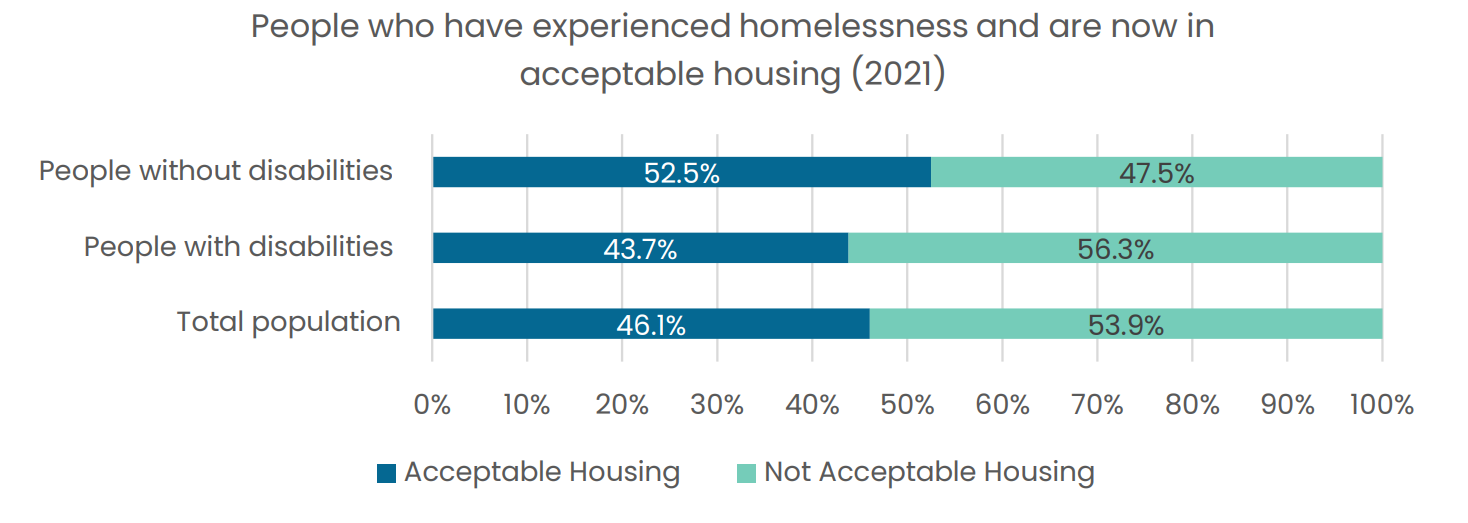
Figure 6 - Text version
| Acceptable Housing | Not Acceptable Housing | |
|---|---|---|
| People without disabilities | 52.5% | 47.5% |
| People with disabilities | 43.7% | 56.3% |
| Total population | 46.1% | 53.9% |
Conclusion
In conclusion, the available data indicates that people with disabilities face significant barriers to housing and are disproportionately affected by homelessness and hidden homelessness across Canada. They are far more likely than people without disabilities to experience these forms of homelessness, and they often remain in these situations for longer periods. People with disabilities also face heightened risks of homelessness driven by economic hardships, relationship breakdowns, and health-related challenges. Additionally, fewer than half of people with disabilities who have experienced homelessness now live in acceptable housing. Addressing these challenges requires a coordinated effort from all levels of government to ensure access to safe, accessible, and affordable housing for people with disabilities.
Read our report with recommendations to address these issues.