To view the full version and footnotes, please consult the PDF copy.
Introduction
The Canadian Human Rights Commission (CHRC) and the Office of the Federal Housing Advocate (OFHA) have legislated mandates to monitor human rights. Together, we are establishing a framework to monitor the right to adequate housing for people with disabilities in Canada. This framework helps to assess whether Canada is meeting its human rights obligations under Canadian and international laws, including the United Nations Convention on the Rights of Persons with Disabilities (CRPD) and the International Covenant on Economic, Social and Cultural Rights (ICESCR). Our work is designed to assist the Government of Canada in fulfilling its responsibility to monitor and report on its human rights obligations.
This monitoring framework tracks housing outcomes, policy efforts and government resources (i.e. spending) in the following eleven areas: institutionalization; homelessness; accessibility; the availability of supports and services; discrimination and dignity; affordability; security of tenure; safety; habitability; location; and cultural adequacy. You can find the indicators for all eleven areas on our website. This report presents the results for the outcome indicators on location.
Location is a key element of the right to adequate housing. The following indicators allow for the monitoring of the percentage of people with disabilities who live near public services and facilities, schools and childcare services, health services, grocery stores, public transportation, and who are satisfied with their neighbourhoods.
We are creating a baseline of results that can be updated as new data becomes available and to help measure progress. We use a variety of data sources to track outcomes, since no single source captures the lived experiences of all people with disabilities in Canada. We also recognize that there are gaps in the data being collected at the time of writing this report. We primarily drew on data from the Canadian Survey on Disability (CSD) from 2017 and 2022 and the Canadian Housing Survey (CHS) from 2021. These two surveys use the social model of disability to identify people with disabilities.
For these indicators, we also relied on the Canadian Income Survey (CIS) from 2019. The CSD and the CIS identify people with disabilities in different ways. Because their populations, sampling frames, and disability measures differ, results from these two surveys should not be directly compared. We disaggregated data to the greatest extent possible, applying an intersectional approach, but due to data gaps we were unable to disaggregate fully. Notable results for particular intersections of identities were included when the data was available.
What people told us
Many people with disabilities told us they do not feel like they are part of their communities. People also said they live far from crucial services and supports.
- “I live on the outskirts of town, and the nearest bus stop is too far for me to walk to. I can't afford a car, so I rely on friends for rides. This neighborhood has no sidewalks and the snow isn't cleared well in the winter, which makes it impossible for me to walk.”
- “We were paying too much of our income for housing, so we had no choice but to move far away from the city. The transition was stressful. Our new place is far from my work and from daycare.”
Analysis
Indicator 1: Percentage of people with disabilities who don't live near public services and facilities.
- People with disabilities have trouble accessing government services because of where they live and because transportation isn't accessible. In 2017, 14% of people with disabilities couldn't access government services for these reasons.
- Women with disabilities face more challenges in accessing government services (21% or 731,870 people) compared to men with disabilities (16.1% or 444,840). 15.5% of women (113,130 women with disabilities) and 12.5% of men (55,550 men with disabilities) cited transportation issues and location as barriers to access (see figure 1).
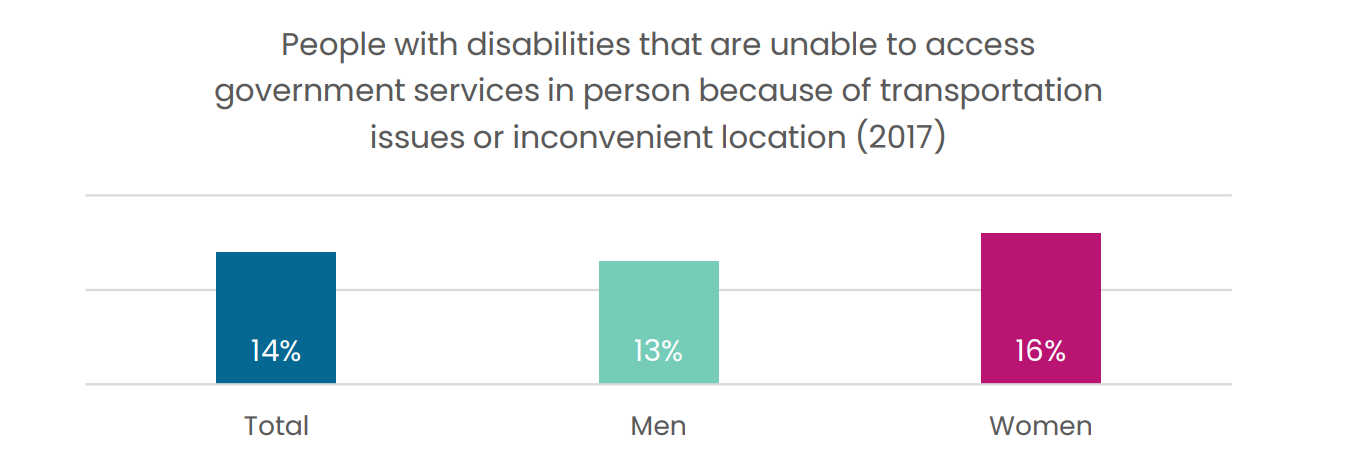
Figure 1 - Text version
| Total | Men | Women |
|---|---|---|
| 14% | 13% | 16% |
For indicators 2, 3, 4, 5, 6, and 7, we were unable to access the data source at the time of writing this report, but understand it is available in the Canadian Housing Survey (2021)'s Proximity Measures Database.
- Indicator 2: Percentage of people with disabilities who live near schools and childcareservices
- Indicator 3: Percentage of people with disabilities who live near health services
- Indicator 4: Percentage of people with disabilities who live near grocery stores
- Indicator 5: Percentage of people with disabilities who live near their workplaces
- Indicator 6: Percentage of public culture, recreation and sports facilities that are accessible
- Indicator 7: Percentage of people with disabilities who can access public transportation
Indicator 8: Percentage of people with disabilities who are satisfied with their neighborhoods and communities
People with disabilities are significantly more likely to report feeling dissatisfied with being part of their community (33.6% or 2,106,110 households) compared to people without disabilities (18.9% or 1,645,230 households). The gap appears largely driven by declining satisfaction over time. 15.9% of people with disabilities (1,000,320 households) reported that their community satisfaction had decreased in the last five years, compared to just 8.7% of people without disabilities (753,570 households) (see figure 2).
Figure 2: 5-year change in community satisfaction (%) by disability status, CHS 2021 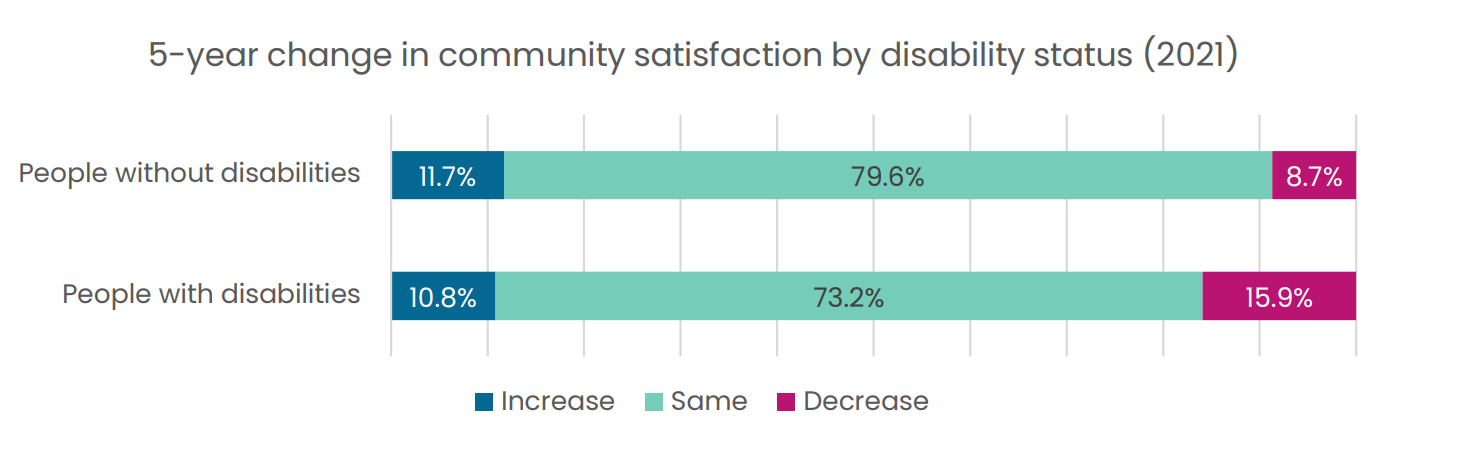
Figure 2 - text version
5-year change in community satisfaction by disability status (2021) Increase Same Decrease People without disabilities 11.7% 79.6% 8.7% People with disabilities 10.8% 73.2% 15.9% People with disabilities are more likely to feel dissatisfied with their neighbourhood (14.3% or 906,410 households) compared to people without disabilities (8.8% or 775,820 households). The gap appears to be influenced by declining satisfaction among people with disabilities since the COVID-19 pandemic (see figure 3). Since the pandemic, 8.3% of people with disabilities (524,530 households) reported a decrease in neighbourhood satisfaction, compared to just 5% of people without disabilities (436,610 households).
Figure 3: Changes in community satisfaction since the COVID-19 pandemic (%) by disability status, CHS 2021 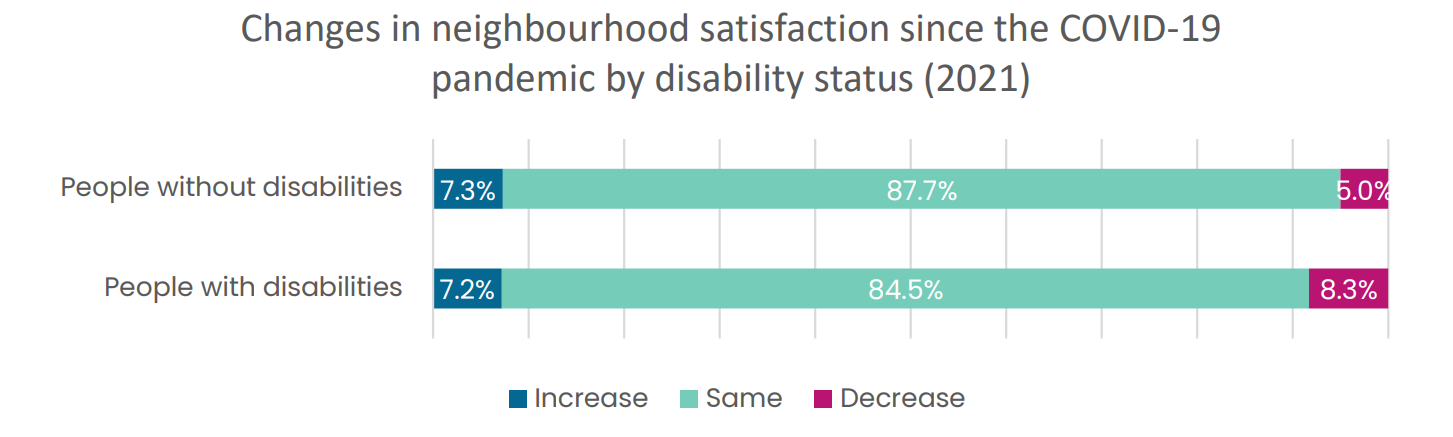
Figure 3 - Text version
Changes in neighbourhood satisfaction since the COVID-19 pandemic by disability status (2021) Increase Same Decrease People without disabilities 7.3% 87.7% 5.0% People with disabilities 7.2% 84.5% 8.3%
Conclusion
In conclusion, the results show consistent gaps in experiences between people with disabilities and people without disabilities, with women with disabilities facing the greatest challenges in accessing government services. People with disabilities are also significantly more likely to report dissatisfaction with both their sense of belonging in their communities and the quality of their neighbourhoods. Additionally, the negative impact of the COVID-19 pandemic on people with disabilities' neighborhood satisfaction highlights the urgent need for accessibility audits to identify and address obstacles in public spaces and transit systems. While some critical insights were identified, the limited availability of comprehensive data across numerous indicators remains a significant barrier to addressing service access challenges and improving inclusion and accessibility for people with disabilities across Canada.
Read our report with recommendations to address these issues.