To view the full version and footnotes, please consult the PDF copy.
Introduction
The Canadian Human Rights Commission (CHRC) and the Office of the Federal Housing Advocate (OFHA) have legislated mandates to monitor human rights. Together, we are establishing a framework to monitor the right to adequate housing for people with disabilities in Canada. This framework helps to assess whether Canada is meeting its human rights obligations under Canadian and international laws, including the United Nations Convention on the Rights of Persons with Disabilities (CRPD) and the International Covenant on Economic, Social and Cultural Rights (ICESCR). Our work is designed to assist the Government of Canada in fulfilling its responsibility to monitor and report on its human rights obligations.
This monitoring framework tracks housing outcomes, policy efforts and government resources (i.e., spending) in the following eleven areas: institutionalization; homelessness; accessibility; the availability of supports and services; discrimination and dignity; affordability; security of tenure; safety; habitability; location; and cultural adequacy. You can find the indicators for all eleven areas on our website. This report presents the results for the outcome indicators on safety.
Safety is a core part of adequate housing. It means that people with disabilities can live free from violence, abuse, neglect, and health risks in their homes and communities. Housing is not adequate if it exposes people to physical danger, unsafe conditions, or harm during emergencies. The goal is for people with disabilities to feel and be safe where they live.
We are creating a baseline of results that can be updated as new data becomes available and to help measure progress. We use a variety of data sources to track outcomes, since no single source captures the lived experiences of all people with disabilities in Canada. We also recognize that there are gaps in the data being collected at the time of writing this report. We primarily drew on data from the Canadian Survey on Disability (CSD) from 2017 and 2022 and the Canadian Housing Survey (CHS) from 2021. These two surveys use the social model of disability to identify people with disabilities.
For this report, we also used the Survey of Safety in Public and Private Spaces (SSPPS) 2018 to capture experiences related to safety, violence, and harassment that are not covered in other national surveys. We disaggregated data to the greatest extent possible, applying an intersectional approach, but due to data gaps we were unable to disaggregate fully. Notable results for particular intersections of identities were included when the data was available.
What people told us
Many people with disabilities told us they feel unsafe at home and in their neighborhoods. This was especially true for women with disabilities.
- “My neighborhood wasn't safe. The elevator frequently broke down and I didn't feel safe in the area or the building. I tried to move to another neighborhood, but I couldn't.”
- “Living on the street is tough. Women get sexually assaulted daily. It's unsafe.”
Analysis
Indicator 1: Percentage of people with disabilities who feel safe and secure in their homes and neighborhoods
- People with disabilities are more likely to feel unsafe or dissatisfied with the safety and security of their homes compared to people without disabilities. Among people with disabilities, 16.5% (1,038,870 households) reported being dissatisfied with the safety and security of their home, compared with 10.2% of people without disabilities (885,620 households). The data showed that 21.1% of women with disabilities and 14.3% of women without disabilities said they were dissatisfied with the safety and security of their home) (see figure 1). Women who are single parents reported the highest levels of dissatisfaction.
- Over one in ten people with disabilities (11% or 871,340 people) report that they are often or always housebound. A higher proportion of women with disabilities (12%) report being often or always housebound compared to men with disabilities (9.5%).
- Among people that were housebound, women with disabilities are more likely to report not feeling safe when leaving the house as a reason for being housebound (22.5%) compared to men with disabilities (18.7%). Overall, women and men reported similar reasons for being housebound, including no motivation or desire, aggravated health condition, mobility restrictions and weather conditions or seasonal limitations. (see figure 2).
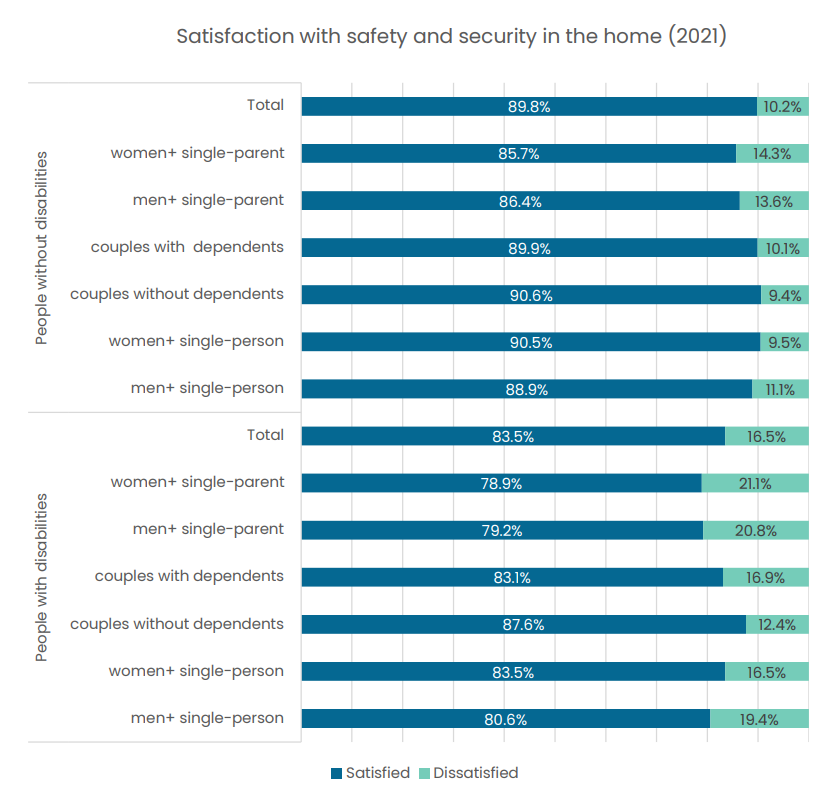
Figure 1 - Text version
| People without disabilities | Satisfied | Dissatisfied |
|---|---|---|
| Total | 89.8% | 10.2% |
| women+ single-person | 85.7% | 14.3% |
| men+ single-parent | 86.4% | 13.6% |
| couples with dependents | 89.9% | 10.1% |
| couples without dependents | 90.6% | 9.5% |
| women+ single-person | 90.5% | 9.5% |
| men+ single-person | 88.9% | 11.1% |
| People with disabilities | Satisfied | Dissatisfied |
|---|---|---|
| Total | 83.5% | 16.5% |
| women+ single-person | 78.9% | 21.1% |
| men+ single-person | 79.2% | 20.8% |
| couples with dependents | 83.1% | 16.9% |
| couples without dependents | 87.6% | 12.4% |
| women+ single-parent | 83.5% | 16.5% |
| men+ single-parent | 80.6% | 19.4% |
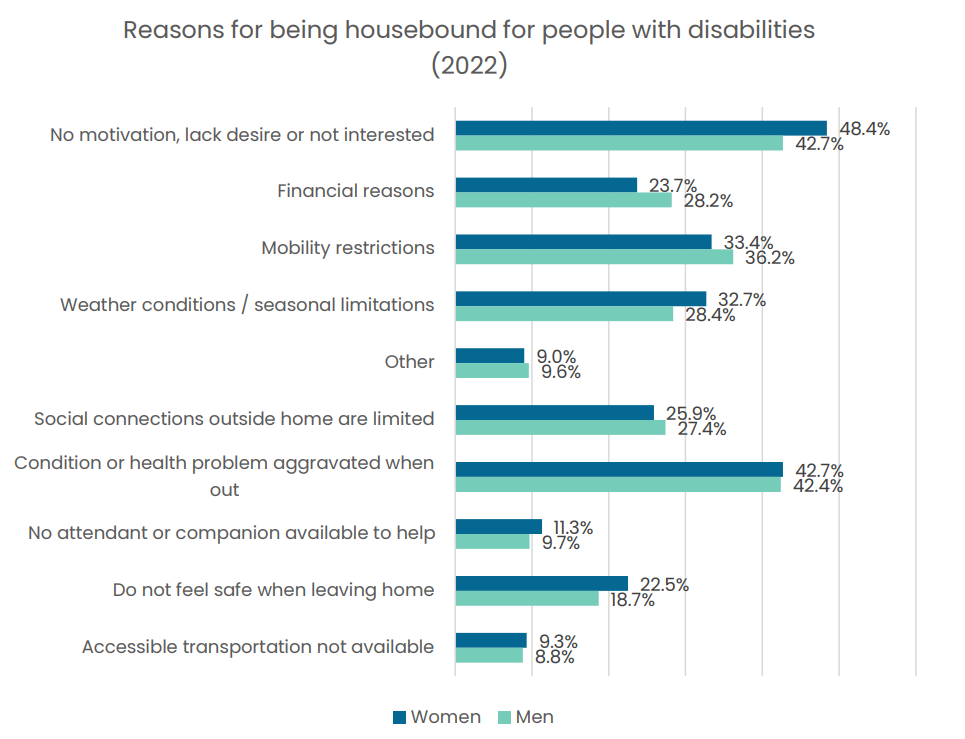
Figure 2 - Text version
| Women | Men | |
|---|---|---|
| No motivation, lack desire or not interested | 48.4% | 42.7% |
| Financial reasons | 23.7% | 28.2% |
| Mobility restrictions | 33.4% | 36.2% |
| Weather conditions / seasonal limitations | 32.7% | 28.4% |
| Other | 9.0% | 9.6% |
| Social connections outside home are limited | 25.9% | 27.4% |
| Condition or health problem aggravated when out | 42.7% | 42.4% |
| No attendant or companion available to help | 11.3% | 9.7% |
| Do not feel safe when leaving home | 22.5% | 18.7% |
| Accessible transportation not available | 9.3% | 8.8% |
Indicator 2: Percentage of people with disabilities who experienced violence or harassment by landlords or other tenants
- Results: Not available. This data is not currently collected through national or provincial/territorial surveys. We are advocating for better data collection and transparency in this area.
Indicator 3: Percentage of people with disabilities who experienced homelessness due to violence or abuse
- Women with disabilities are more likely to experience homelessness because of violence or abuse compared to women without disabilities. In 2018, 62.9% of women with disabilities who experienced homelessness reported leaving an abusive or violent situation (148,403 women), compared to 53.6% of women without disabilities (48,660 women).
- Men with disabilities still experienced higher rates of homelessness due to violence or abuse (38.9%) than men without disabilities (23.8%).
- More than half of women with disabilities that experienced hidden homelessness reported that it was because they had to leave an abusive or violent situation. Among people with disabilities that experienced hidden homelessness, 44.5% reported that it was because they had to leave an abusive or violent situation (767,079 respondents), compared to 33.1% of people without disabilities (450,407 respondents). This highlights the vulnerability among people with disabilities, with a particularly stark contrast in the difference between women with disabilities (54.5% or 513,769 respondents) and men with disabilities (30.9% or 235,323 respondents) (see figure 4).
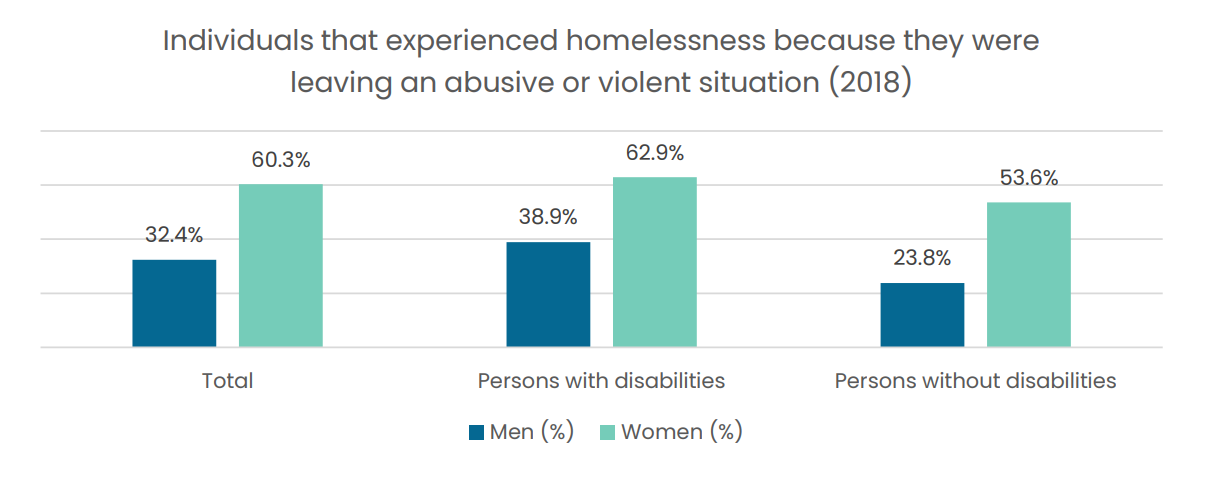
Figure 3 - text version
| Men (%) | Women (%) | |
|---|---|---|
| Total | 32.4% | 60.3% |
| Persons with disabilities | 38.9% | 62.9% |
| Persons without disabilities | 23.8% | 53.6% |
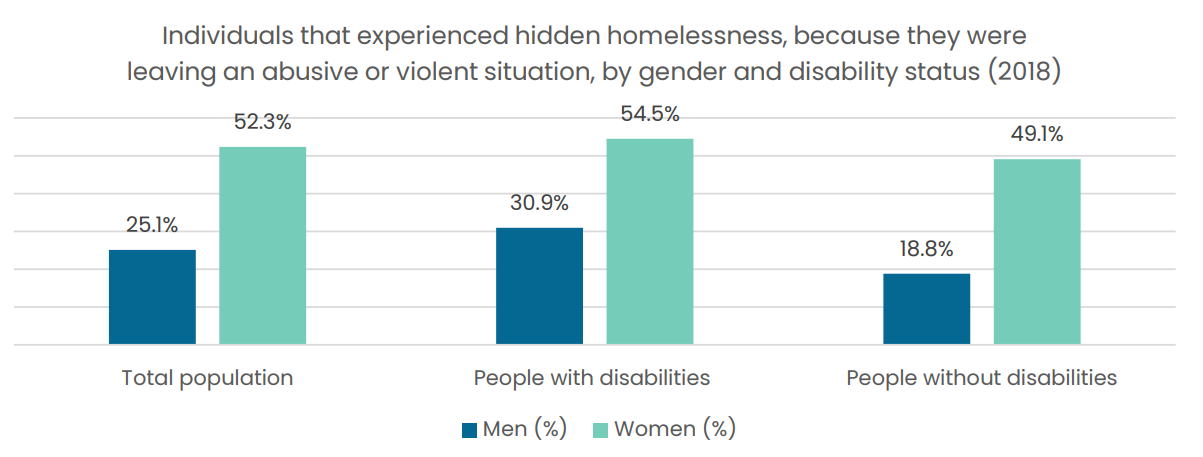
Figure 4 - text version
| Men (%) | Women (%) | |
|---|---|---|
| Total population | 25.1% | 52.3% |
| People with disabilities | 30.9% | 54.5% |
| People without disabilities | 18.8% | 49.1% |
Indicator 4: Percentage of people with disabilities who experienced violence or abuse while homelessness
- Results: Not available. This data is not currently collected through national or provincial/territorial surveys. We are advocating for better data collection and transparency in this area.
Indicator 5: Rate of exposure to health risks for people living in institutions
- Results: Not available. This data is not currently collected through national or provincial/territorial surveys. We are advocating for better data collection and transparency in this area.
Conclusion
In conclusion, the available data indicates that people with disabilities are more likely to feel unsafe or dissatisfied with the safety and security of their homes compared to people without disabilities. They are also more likely to be housebound. Safety and security in housing also intersect with gender and disability in important ways. Women with disabilities are especially vulnerable to both homelessness and hidden homelessness because of violence or abuse. The findings make clear that addressing housing insecurity for women and gender-diverse people requires a comprehensive approach that recognizes the intersections between homelessness, gender-based violence, disability, and social isolation.
Read our report with recommendations to address these issues.