To view the full version and footnotes, please consult the PDF copy.
Introduction
The Canadian Human Rights Commission (CHRC) and the Office of the Federal Housing Advocate (OFHA) have legislated mandates to monitor human rights. Together, we are establishing a framework to monitor the right to adequate housing for people with disabilities in Canada. This framework helps to assess whether Canada is meeting its human rights obligations under Canadian and international laws, including the United Nations Convention on the Rights of Persons with Disabilities (CRPD) and the International Covenant on Economic, Social and Cultural Rights (ICESCR). Our work is designed to assist the Government of Canada in fulfilling its responsibility to monitor and report on its human rights obligations.
This monitoring framework tracks housing outcomes, policy efforts and government resources (i.e., spending) in the following eleven areas: institutionalization; homelessness; accessibility; the availability of supports and services; discrimination and dignity; affordability; security of tenure; safety; habitability; location; and cultural adequacy. You can find the indicators for all eleven areas on our website. This report presents the results for the outcome indicators on security of tenure.
Security of tenure is a key component of the right to adequate housing. It means that everyone should have legal protection against eviction, harassment, or forced displacement, regardless of whether they rent, own, or live in other forms of housing. In practice, security of tenure ensures that people can live in their homes with stability and dignity.
We are creating a baseline of results that can be updated as new data becomes available and to help measure progress. We use a variety of data sources to track outcomes, since no single source captures the lived experiences of all people with disabilities in Canada. We also recognize that there are gaps in the data being collected at the time of writing this report. We primarily drew on data from the Canadian Survey on Disability (CSD) from 2017 and 2022 and the Canadian Housing Survey (CHS) from 2021. These two surveys use the social model of disability to identify people with disabilities. We disaggregated data to the greatest extent possible, applying an intersectional approach but due to data gaps we were unable to disaggregate fully. Notable results for particular intersections of identities were included when the data was available.
What people told us
People with disabilities told us they are at risk of being evicted by their landlords, and they face barriers in asserting their rights.
- “My landlord decided to sell his property and evicted me in the fall of 2018. I lost my home and my reason for living. Life has been hellish ever since. It's over for me, but I am trying to advocate for younger people caught in this horrible situation.”
Analysis
Indicator 1: Percentage of people with disabilities who are homeowners, and percentage who are renters
- Over the past 5 years, people with disabilities are more likely to rent their homes compared to people without disabilities. In 2017, 32.5% of people with disabilities were renters (2,033,010 people), compared to 24.9% of people without disabilities (5,677,140 people) (see figure 1). This trend was also observed in 2022, where 32.2% of people with disabilities (2,565,810 people) were renters, compared to 26.3% of people without disabilities (5,424,090 people) (see figure 2).
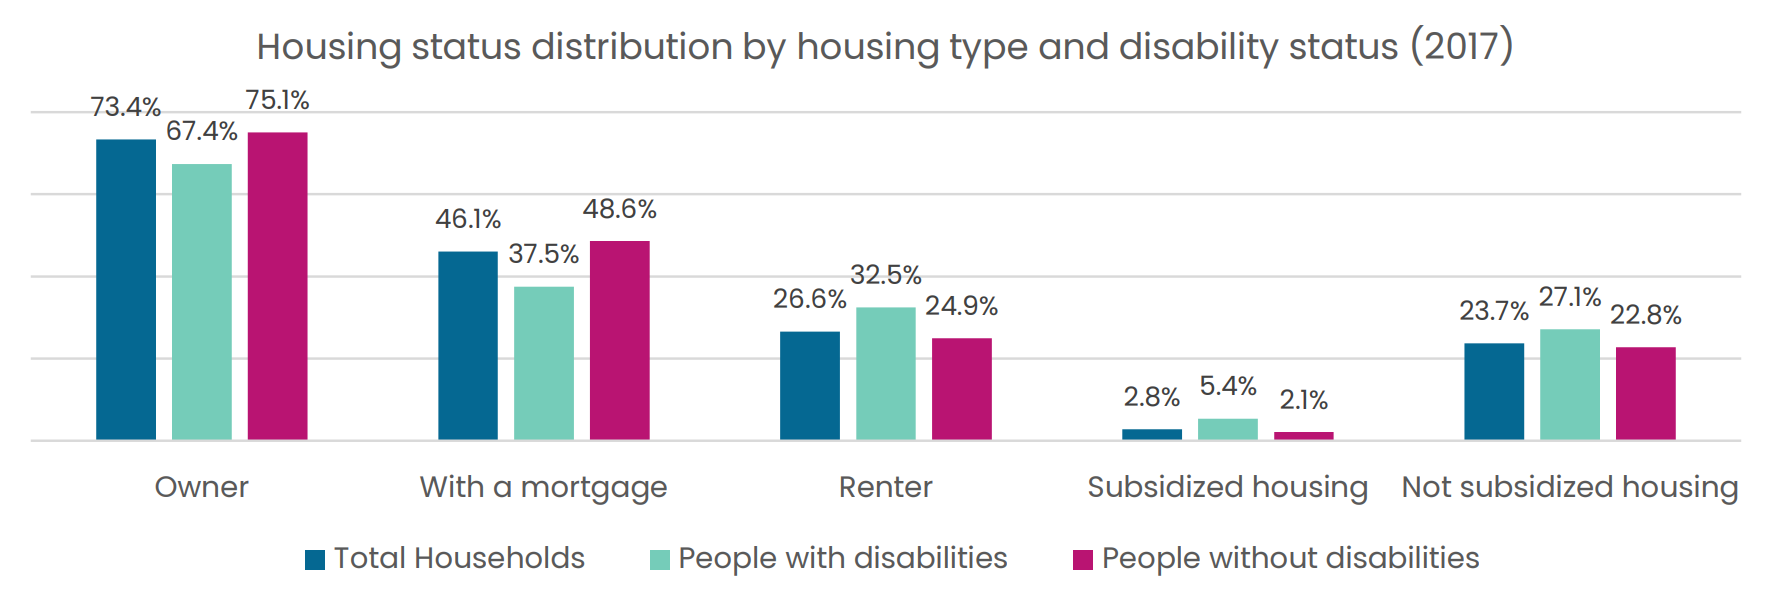
Figure 1 - Text version
| Total Households | People with disabilities | People without disabilities | |
|---|---|---|---|
| Owner | 73.4% | 67.4% | 75.1% |
| With a mortgage | 46.1% | 37.5% | 48.6% |
| Renter | 26.6% | 32.5% | 24.9% |
| Subsidized housing | 2.8% | 5.4% | 2.1% |
| Not subsidized housing | 23.7% | 27.1% | 22.8% |
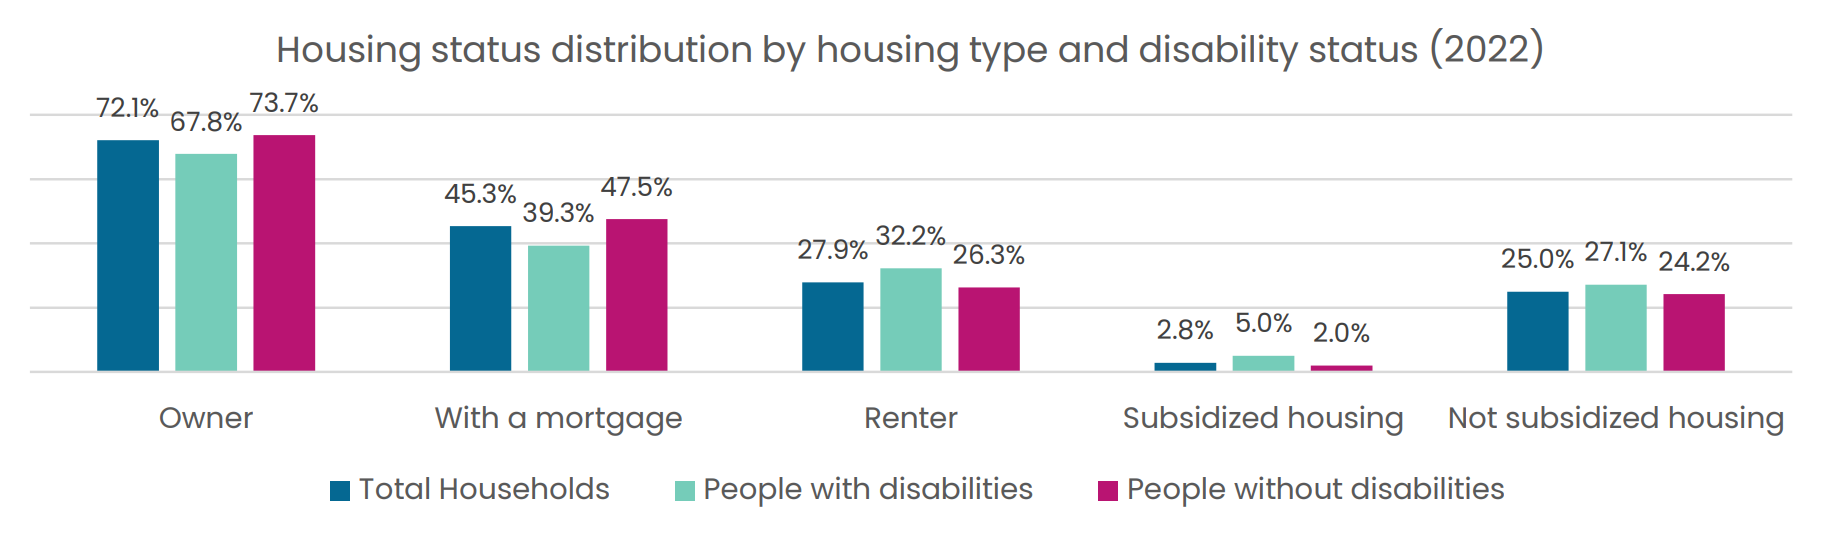
Figure 2 - Text version
| Total Households | People with disabilities | People without disabilities | |
|---|---|---|---|
| Owner | 72.1% | 67.8% | 73.7% |
| With a mortgage | 45.3% | 39.3% | 47.5% |
| Renter | 27.9% | 32.2% | 26.3% |
| Subsidized housing | 2.8% | 5.0% | 2.0% |
| Not subsidized housing | 25.0% | 27.1% | 24.2% |
Indicator 2: Percentage of people with disabilities who have been evicted
- Renter households that include people with disabilities are more likely to be forced to move than renter households without people with disabilities. Among renter households, a higher percentage of people with disabilities were forced to move between 2016 and 2021. In total, 7.2% of renter households that included people with disabilities (166,790 households) were forced to move from a dwelling they rented in the past 5 years, compared with 5.0% of renter households without people with disabilities (127,370 households) during the same period.
Indicator 3: Percentage of people with disabilities who experienced an eviction before moving to housing with subsidies
- People with disabilities living in housing with subsidies are three times more likely to have experienced an eviction than people without disabilities. Among those living in housing with subsidies, 63,130 people with disabilities reported having experienced an eviction, compared with 18,930 people without disabilities. This represents approximately 17% of people with disabilities, but only 10.5% of people without disabilities living in housing with subsidies (see figure 3).
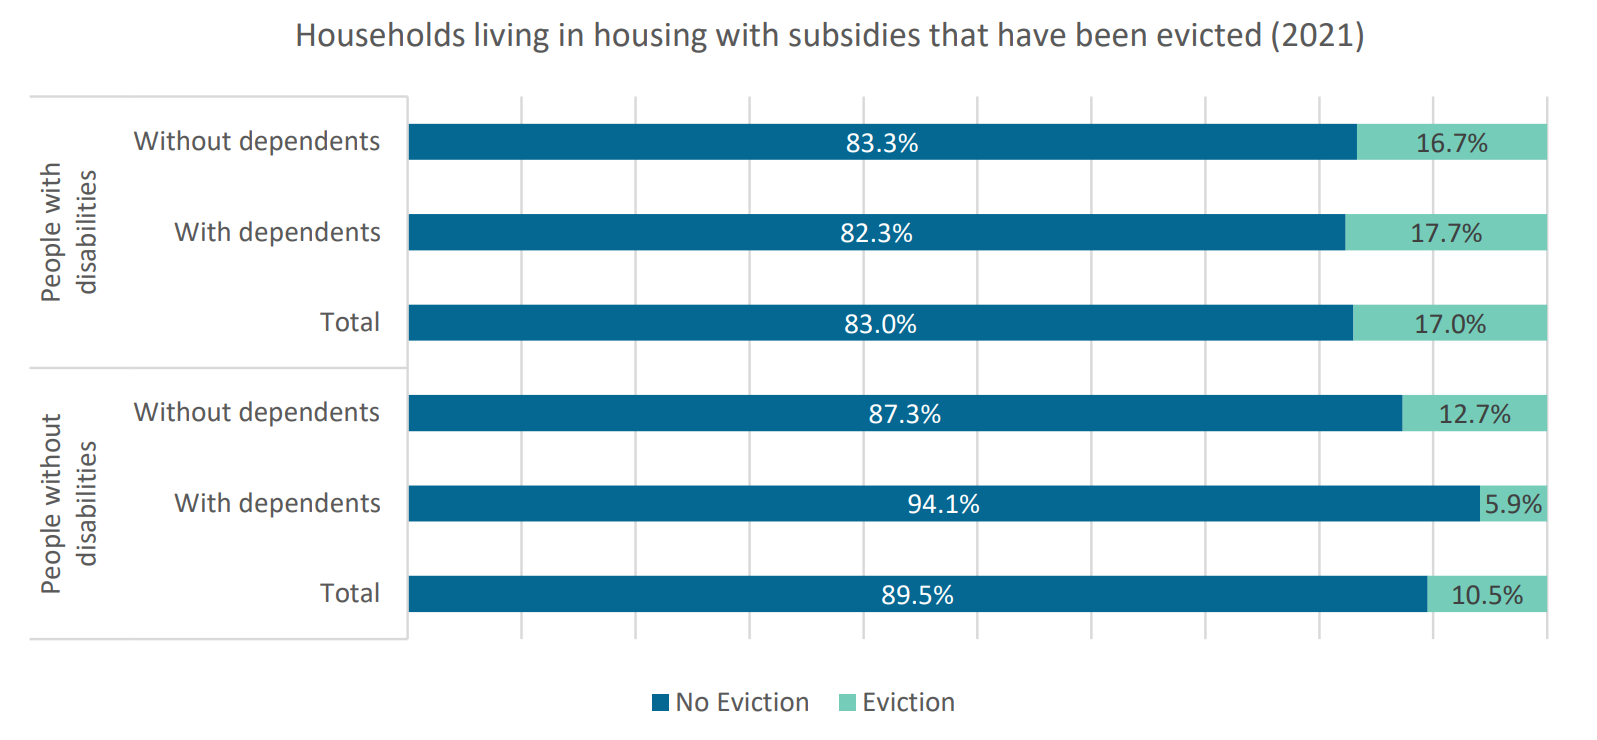
Figure 3 - text version
| People with disabilities | No Eviction | Eviction |
|---|---|---|
| Without dependents | 83.3% | 16.7% |
| With dependents | 82.3% | 17.7% |
| Total | 83.0% | 17.0% |
| People without disabilities | No Eviction | Eviction |
|---|---|---|
| Without dependents | 87.3% | 12.7% |
| With dependents | 94.1% | 5.9% |
| Total | 89.5% | 10.5% |
Indicator 4: Percentage of people with disabilities who received a formal notice when they were last forced to move
- Many people with disabilities are evicted without receiving a formal notice, and this issue affects people without disabilities at similar rates. When looking at households that were forced to move, 43.3% of households that included people with disabilities (247,490 households) and 42.2% of households without people with disabilities (188,720 households) reported that they did not receive a formal notice of eviction. The similar percentages suggest that the lack of formal eviction notice is a widespread issue affecting both groups at comparable rates.
Indicator 5: Percentage of people with disabilities who were forced to move for economic reasons
- People with disabilities are more likely to be forced to move for economic reasons than people without disabilities. In 2021, 11% of people with disabilities who had been forced to move in their lifetime said the reason was economic, compared with 7% of people without disabilities.
Indicator 6: Percentage of people with disabilities who were forced to move because of conflicts with landlords, neighbours, or other residents
- People with disabilities are almost twice as likely to be forced to move because of conflicts with landlords, neighbours, or other residents compared to people without disabilities. Among households that include people with disabilities that have experienced an eviction, 18.9% of respondents (108,380 respondents) reported being forced to move because of conflict with landlords, neighbours or other residents, compared with 11.9% of people without disabilities (53,180 respondents).
Indicator 7: Percentage of people with disabilities who experienced “nofault” evictions
- “No-fault” evictions are the most common reason people are forced to move in Canada, though people with disabilities experience them at lower rates than people without disabilities. Among all households who reported having experienced an eviction, 68.9% (703,620 respondents) said they had been forced to move due to a “no-fault” reason. Among people with disabilities, 64.3% (368,480 respondents) experienced a “no-fault” eviction, compared with 74.7% of people without disabilities (335,150 respondents).
Conclusion
The current disparities in housing tenure are leaving many people with disabilities vulnerable to unfair treatment and eviction. The available data indicates that people with disabilities face higher and more complex risks related to housing instability and eviction than people without disabilities. They are more likely to be renters, placing them in more precarious housing situations, and renter households that include people with disabilities are more frequently forced to move. Among those living in housing with subsidies, people with disabilities are also three times more likely to have experienced an eviction, highlighting deeper systemic vulnerabilities. While the lack of formal eviction notices affects both groups at similar rates, people with disabilities are disproportionately forced to move for economic reasons and are nearly twice as likely to be displaced due to conflicts with landlords, neighbours, or other residents. People with disabilities told us they are at risk of being evicted by their landlords, and they face barriers in asserting their rights.
Read our report with recommendations to address these issues.