To view the full version and footnotes, please consult the PDF copy.
Introduction
The Canadian Human Rights Commission (CHRC) and the Office of the Federal Housing Advocate (OFHA) have legislated mandates to monitor human rights. Together, we are establishing a framework to monitor the right to adequate housing for people with disabilities in Canada. This framework helps to assess whether Canada is meeting its human rights obligations under Canadian and international laws, including the United Nations Convention on the Rights of Persons with Disabilities (CRPD) and the International Covenant on Economic, Social and Cultural Rights (ICESCR). Our work is designed to assist the Government of Canada in fulfilling its responsibility to monitor and report on its human rights obligations.
This monitoring framework tracks housing outcomes, policy efforts and government resources (i.e., spending) in the following eleven areas: institutionalization; homelessness; accessibility; the availability of supports and services; discrimination and dignity; affordability; security of tenure; safety; habitability; location; and cultural adequacy. You can find the indicators for all eleven areas on our website. This report presents the results for the outcome indicators on supports and services
Supports and services are a key component of adequate housing for people with disabilities. They include the disability-related supports needed to live independently, as well as equal access to basic services like safe drinking water, heat, electricity, and internet. Housing is not adequate if people with disabilities cannot obtain the supports and services required to live safely, with dignity, and on an equal basis with others.
We are creating a baseline of results that can be updated as new data becomes available and to help measure progress. We use a variety of data sources to track outcomes, since no single source captures the lived experiences of all people with disabilities in Canada. We also recognize that there are gaps in the data being collected at the time of writing this report. We primarily drew on data from the Canadian Survey on Disability (CSD) from 2017 and 2022 and the Canadian Housing Survey (CHS) from 2021. These two surveys use the social model of disability to identify people with disabilities. We disaggregated data to the greatest extent possible, applying an intersectional approach, but due to data gaps we were unable to disaggregate fully. Notable results for particular intersections of identities were included when the data was available.
What people told us
Many people with disabilities told us they do not have the supports and services they need to live independently in their chosen communities.
- “My sons live with me because they don't have supports and can't afford to live on their own. I'm 68 years old. I worry about what will happen to them when I'm gone. The waitlists for supportive housing are 7 years or more.”
- “I don't have supports to look after myself at home. I have to use a house cleaner that I can't afford.”
Analysis
Indicator 1: Percentage of people with disabilities who have the supports they need to live independently
- Many people with disabilities don't get the help they need at home. In 2017, of all people with disabilities who said they needed help, 24% didn't receive enough help. 13% didn't receive any help. In 2022, of all people with disabilities who said they needed help, 22% didn't receive enough help. 16% didn't receive any help.
- Between 2017 and 2022, more people with disabilities needed help at home but weren't getting it, showing that access to everyday supports is getting worse. The most common type of help that people with disabilities reported needing in 2022 was with heavy household chores (2,910,450 people) followed by everyday housework (2,317,880 people), getting to appointments or running errands (2,131,790 people), preparing meals (1,699,970 people), looking after personal finances (1,245,060 people), personal care (843,370 people), basic medical care at home (537,000 people), and moving around the residence (455,770 people) (see figures 1 and 2).
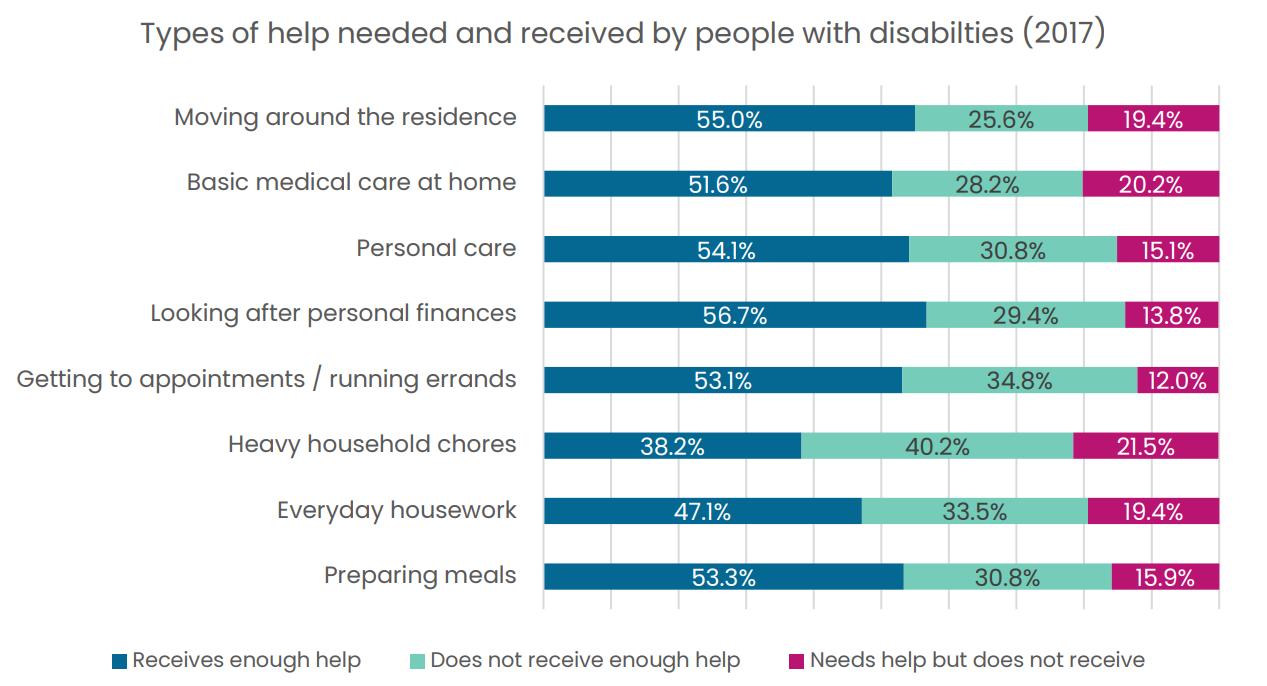
Figure 1 - Text version
| Receives enough help | Does not receive enough help | Needs help but does not receive | |
|---|---|---|---|
| Moving around the residence | 55.0% | 25.6% | 19.4% |
| Basic medical care at home | 51.6% | 28.2% | 20.2% |
| Personal care | 54.1% | 30.8% | 15.1% |
| Looking after personal finances | 56.7% | 29.4% | 13.8% |
| Getting to appointments / running errands | 53.1% | 34.8% | 12.0% |
| Heavy household chores | 38.2% | 40.2% | 21.5% |
| Everyday housework | 47.1% | 33.5% | 19.4% |
| Preparing meals | 53.3% | 30.8% | 15.9% |
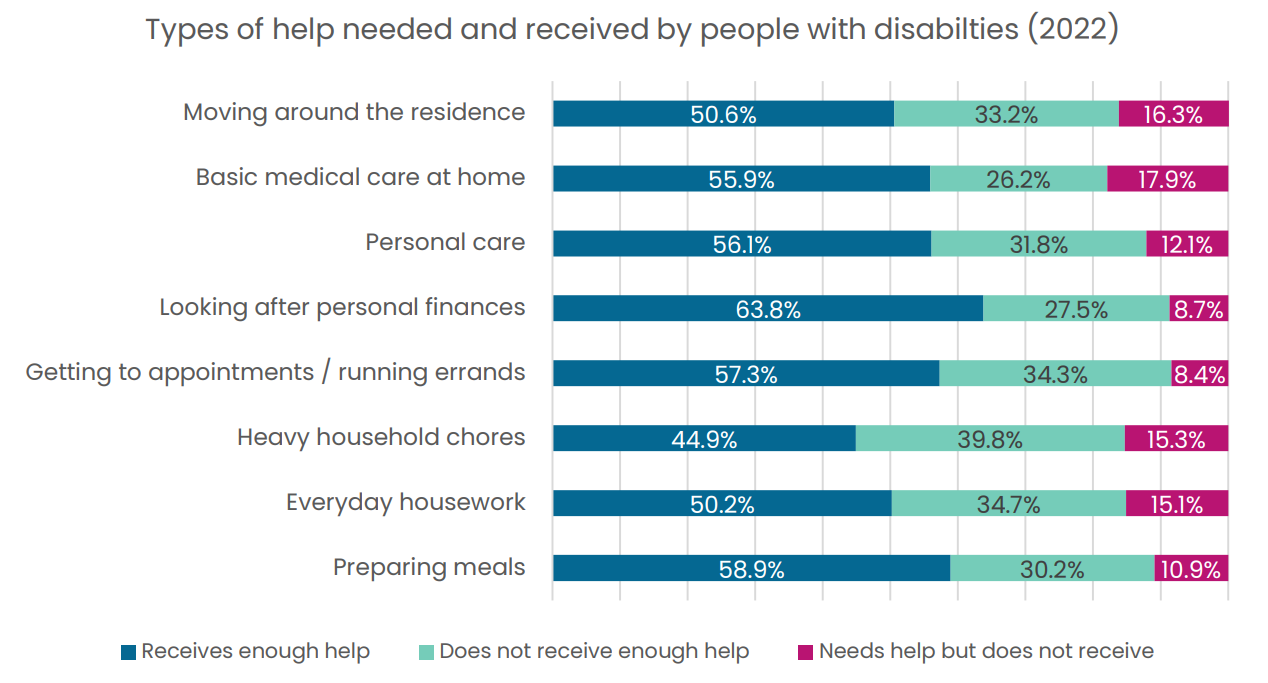
Figure 2 - Text version
| Receives enough help | Does not receive enough help | Needs help but does not receive | |
|---|---|---|---|
| Moving around the residence | 50.6% | 33.2% | 16.3% |
| Basic medical care at home | 55.9% | 26.2% | 17.9% |
| Personal care | 56.1% | 31.8% | 12.1% |
| Looking after personal finances | 63.8% | 27.5% | 8.7% |
| Getting to appointments / running errands | 57.3% | 34.3% | 8.4% |
| Heavy household chores | 44.9% | 39.8% | 15.3% |
| Everyday housework | 50.2% | 34.7% | 15.1% |
| Preparing meals | 58.9% | 30.2% | 10.9% |
Indicator 2: Percentage of people with disabilities who don't have safe drinking water at home
- Households with people with disabilities are more likely to report having undrinkable water. 2.9% of all households reported having issues with undrinkable water (432,660 households). Among households led by a person with a disability, 3.7% (about 232,830 households) said their water was not safe to drink, a higher rate than households without people with disabilities (2.3%, or 199,830 households).
- People with disabilities are disproportionately represented in household types associated with greater vulnerability. Single-parent households with people with disabilities experienced undrinkable water at a higher rate (15.4% or 35,770 households) compared to single-parent households without people with disabilities (7.5% or 14,950 households), highlighting the compounded effects of disability and caregiving responsibility. Women with disabilities living alone are also over-represented among households who reported having undrinkable water, representing 20.6% (48,040 households) among households with disabilities versus 16.1% (32,130 households) among households without disabilities. In addition, couples without dependents account for a higher share among households with disabilities (24.7% or 57,500 households) than among households without disabilities (21.6% or 43,260 households) (see figure 3).
Indicator 3: Percentage of people with disabilities who have poor air quality at home
- Households with people with disabilities are more likely to report having poor air quality at home. 9.1% of all households reported having issues with air quality at home (1,374,730 households). Among households where the primary respondent was a person with a disability, 12.2% of households (768,330 households) reported having issues with air quality at home, which is higher than the percentage among households where the primary respondents were people without disabilities at 7.0% (606,400 households).
Indicator 4: Percentage of people with disabilities that are satisfied with their heating and cooling systems that work
- Households with people with disabilities are more likely to be dissatisfied with being able to maintain a comfortable temperature during the winter and summer months, than households without people disabilities. Among households including people with disabilities, 31% (1,959,650 households) reported being dissatisfied with being able to maintain a comfortable temperature in the winter, compared to 20.8% (1,819,250 households) of households without disabilities. People with disabilities were also more likely to be dissatisfied with maintaining a comfortable temperature in the summer. Among households including people with disabilities, 35.5% (2,243,500 households) reported not being able to maintain a comfortable summer temperature, compared to 24.5% (2,138,930 households) of households without people with disabilities.
Women with disabilities that were in single-parent households were the highest proportion of respondents that were dissatisfied with being able to maintain a comfortable temperature in both the summer and winter months. About 47% of women with disabilities who were single parents were dissatisfied with being able to maintain a comfortable temperature in the summer months, compared to 29% of women without disabilities who were single parents (see Figure 4). 37% of women with disabilities that were single parents were dissatisfied with being able to maintain a comfortable temperature in the winter months, compared to 29% of women without disabilities that were single parents (see figure 5).
Figure 4: Percentage of household satisfactions with maintaining a comfortable temperature in the summer by household type and disability status, CHS 2021 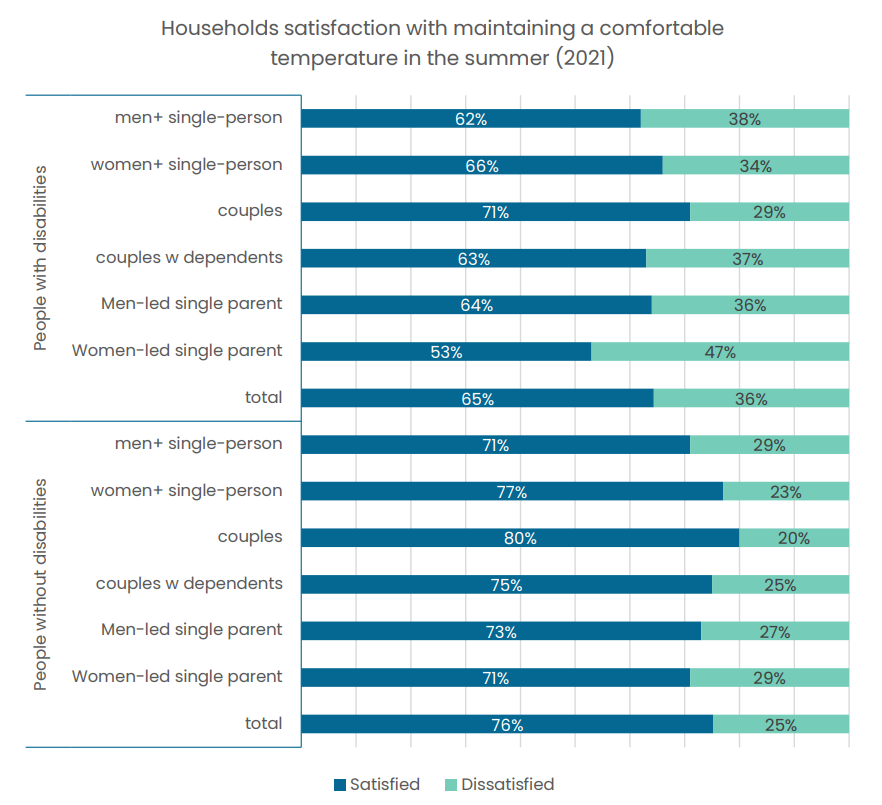
Figure 4 - Text version
1- Households satisfaction with maintaining a comfortable temperature in the summer (2021) People with disabilities Satisfied Dissatisfied men+ single-person 62% 38% women+ single-person 66% 34% couples 71% 29% couples w dependents 63% 37% Men-led single parent 64% 36% Women-led single parent 53% 47% total 65% 36% 2- Households satisfaction with maintaining a comfortable temperature in the summer (2021) People without disabilities Satisfied Dissatisfied men+ single-person 71% 29% women+ single-person 77% 23% couples 80% 20% couples w dependents 75% 25% Men-led single parent 73% 27% Women-led single parent 71% 29% total 76% 25% Figure 5: Percentage of household satisfaction with maintaining a comfortable temperature in the summer by household type and disability status, CHS 2021 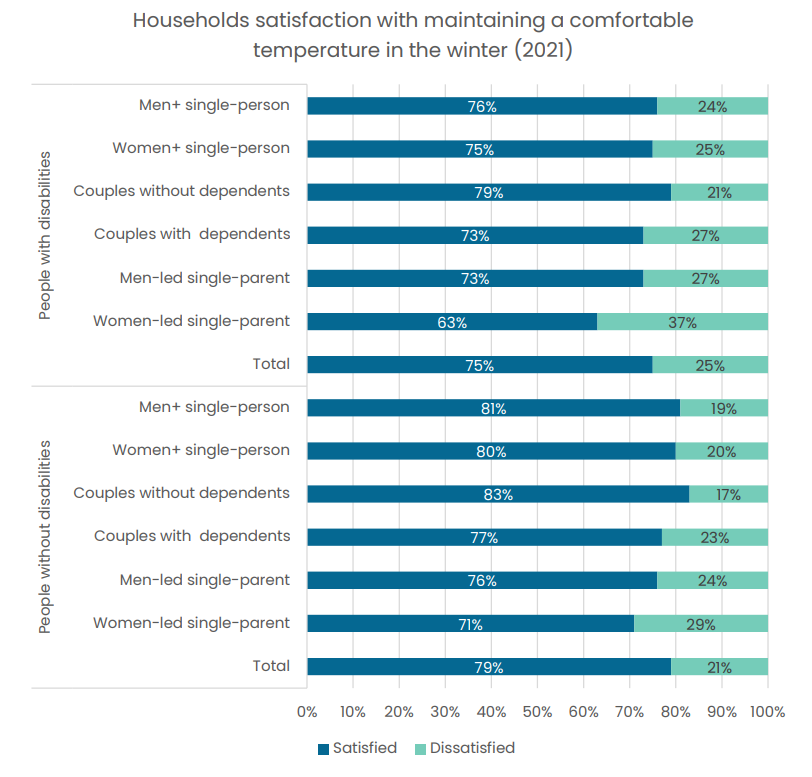
Figure 5 - Text version
1- Households satisfaction with maintaining a comfortable temperature in the winter (2021) People with disabilities Satisfied Dissatisfied Men+ single-person 76% 24% Women+ single-person 75% 25% Couples without dependents 79% 21% Couples with dependents 73% 27% Men-led single-parent 73% 27% Women-led single-parent 63% 37% Total 75% 25% 2- Households satisfaction with maintaining a comfortable temperature in the winter (2021) People without disabilities Satisfied Dissatisfied Men+ single-person 81% 19% Women+ single-person 80% 20% Couples without dependents 83% 17% Couples with dependents 77% 23% Men-led single-parent 76% 24% Women-led single-parent 71% 29% Total 79% 21%
Indicator 5: Percentage of people with disabilities who don't have reliable internet access at home
- The number of people with disabilities that do not use the internet because they have limited or no access increased between 2017 and 2022. In 2017, approximately 1,215,340 people with disabilities in Canada reported that they never used the internet, and 1.7% of them (20,570 people) said this was due to limited or no access. By 2022, the number of people with disabilities who never used the internet had decreased to 1,162,980, but a much larger share, 6% (70,210 people), reported that limited or no access to internet was the reason.
Conclusion
The available data confirms what people with disabilities have long said: they are unable to access the supports and services they need. People with disabilities are not receiving the supports they need at home and these unmet needs are compounded by higher rates of unsafe drinking water, poorer air quality, and greater dissatisfaction with maintaining comfortable temperatures in both winter and summer. Gender-based analysis further highlights that women with disabilities—especially those in single-parent households—face even greater challenges, with disproportionately higher levels of dissatisfaction related to heating and cooling and over-representation in household types associated with vulnerability. Although internet non-use declined overall, a growing share of people with disabilities now cite limited or no access as the reason they remain offline, underscoring persistent digital inequities. Addressing the barriers faced by people with disabilities in Canada requires a comprehensive and inclusive approach that prioritizes accessibility, affordability, and equity.
Read our report with recommendations to address these issues.rapport qui contient des recommandations.