The Canadian Human Rights Commission (CHRC) is Canada's national human rights institution. We have a broad mandate to promote and protect human rights and freedoms in Canada. We are also responsible for monitoring Canada's implementation of the United Nations (UN) Convention on the Rights of Persons with Disabilities (CRPD). Learn more about the CHRC's work.
The Federal Housing Advocate is appointed under the National Housing Strategy Act. The Advocate is responsible for monitoring the progressive realization of the right to adequate housing in Canada. They monitor systemic housing issues, including barriers to housing for people with disabilities. The Office of the Federal Housing Advocate (OFHA) is based at the CHRC. Learn more about the OFHA's work.
The CHRC and the OFHA have collaborated to monitor the right to adequate housing for people with disabilities in Canada. This work is especially important since the number of people with disabilities in Canada is growing.Footnote 1 Working closely with people with disabilities and experts, we developed a framework to monitor whether Canada is meeting its obligations under domestic and international human rights laws, including the CRPD. Our monitoring framework is an accountability tool based on the OPERA framework for monitoring economic and social rights. It uses publicly available data to track outcomes, policy efforts and government resources (i.e. spending) in the following eleven areas: institutionalization; homelessness; accessibility; the availability of supports and services; discrimination and dignity; affordability; security of tenure; safety; habitability; location; and cultural adequacy.Footnote 2
Our monitoring framework is the first of its kind. This report provides an overview of some of our key outcome indicator results to date.Footnote 3 The data we collected confirms that people with disabilities face numerous barriers in exercising their right to adequate housing. This results in disparate housing outcomes.
We used a variety of data sources for our framework, since no single data source captures the lived experiences of all people with disabilities in Canada. We primarily used data from the Canadian Survey on Disability (CSD) from 2017 and 2022 and the Canadian Housing Survey (CHS) from 2021. These two surveys use the social model of disability to identify people with disabilities. Unlike the medical model, which focuses on people's impairments, the social model focuses on the barriers people with disabilities face when interacting with their environments.
Both surveys allow for comparisons between people with disabilities and people without disabilities, but they count people with disabilities in different ways. CSD respondents are individuals with disabilities, whereas CHS respondents are individuals answering on behalf of their households.Footnote 4 If people with disabilities are not the CHS respondents for their households, they may not be counted in CHS data.Footnote 5 This contributes to gaps in the data about the housing experiences of people with disabilities. We have been advocating for Canada to address these data gaps.
Using an intersectional approach, we have disaggregated data to the greatest extent possible to identify whether certain groups of people with disabilities face additional barriers. We were unable to disaggregate data by province and territory due to budgetary and time constraints.
This report provides recommendations to help advance the right to adequate housing for people with disabilities in Canada, including recommendations to address data gaps.
People with disabilities told us they had experienced homelessness because they lived in poverty, they could not work, and they could not survive on their disability benefits.
“I'm disabled, homeless and hungry all the time. I can't think about anything else.”
“When you're homeless, every day is a struggle. It's a struggle to meet basic needs like staying warm, dry and fed. We are shunned, displaced and harassed. We don't have security, heat, a shower, or a toilet. We don't have privacy or stability. We get robbed and abused. Police and bylaw officers criminalize us. They make us move. This is making my PTSD and my health problems worse.”
Results:
People with disabilities are nearly four times more likely to experience homelessness than people without disabilities. In 2021, about 3.9% of people with disabilities said they'd experienced homelessness in their lifetime. This was compared to only 1.1% of people without disabilities.Footnote 8
People with disabilities are more than twice as likely to experience hidden homelessness. In 2021, about 1,023,330 people with disabilities (16.2%) said they had experienced hidden homelessness. This was compared to 564,310 people without disabilities (6.5%).Footnote 9
People with disabilities are more than twice as likely to experience homelessness due to health issues. In 2021, about 47,370 people with disabilities (19.7%) said their most recent experience of homelessness was due to health issues. This was compared to only 8,010 people without disabilities (8.9%).Footnote 10
People with disabilities have housing that meets their accessibility needs.Footnote 12
What people told us:
Many people with disabilities told us they can't find accessible housing in Canada. They said this violates their human rights and limits their dignity and independence.
“Finding housing that is accessible is horrific. It doesn't matter how much money you have. Everything that's being built excludes persons with disabilities. There is a brand new, very nice condo downtown. The front door has automatic doors, but the entrance is at the top of a flight of stairs!”
“I could not find an accessible home. There are 6 steps to get into my home. The pain and difficulty I have is too much to bear. Sometimes I stay inside because of it.”
Results:
More people with physical disabilities had or needed a physical aid at home in 2022 than in 2017. In 2017, about 1,715,640 people with physical disabilities had or needed a physical aid, such as a walk-in shower.Footnote 13 In 2022, this number went up to 1,928,520 people.Footnote 14
More people with physical disabilities didn't have a physical aid they needed at home in 2022 than in 2017. In 2017, about 251,110 people with physical disabilities who needed an aid at home said they did not have at least one type of physical aid.Footnote 15 In 2022, this number went up to 310,330 people.Footnote 16
Less than 1 in 10 publicly owned social and affordable housing units in Canada is accessible. In 2016, about 9.8% of these units were accessible. In 2020, this number went down to 8.9%.Footnote 17
Supports and Services
Goal:
People with disabilities have access to the support they need to live independently in the community. They have equal access to basic services and infrastructure.
What people told us:
Many people with disabilities told us they do not have the supports and services they need to live independently in their chosen communities.
“My sons live with me because they don't have supports and can't afford to live on their own. I'm 68 years old. I worry about what will happen to them when I'm gone. The waitlists for supportive housing are 7 years or more.”
“I don't have supports to look after myself at home. I have to use a house cleaner that I can't afford.”
Results:
The number of people with disabilities who needed help at home but did not get it increased between 2017 and 2022. In 2017, 835,390 people with disabilities needed help at home but did not get it. In 2022, this increased to 1,289,380 people.Footnote 18
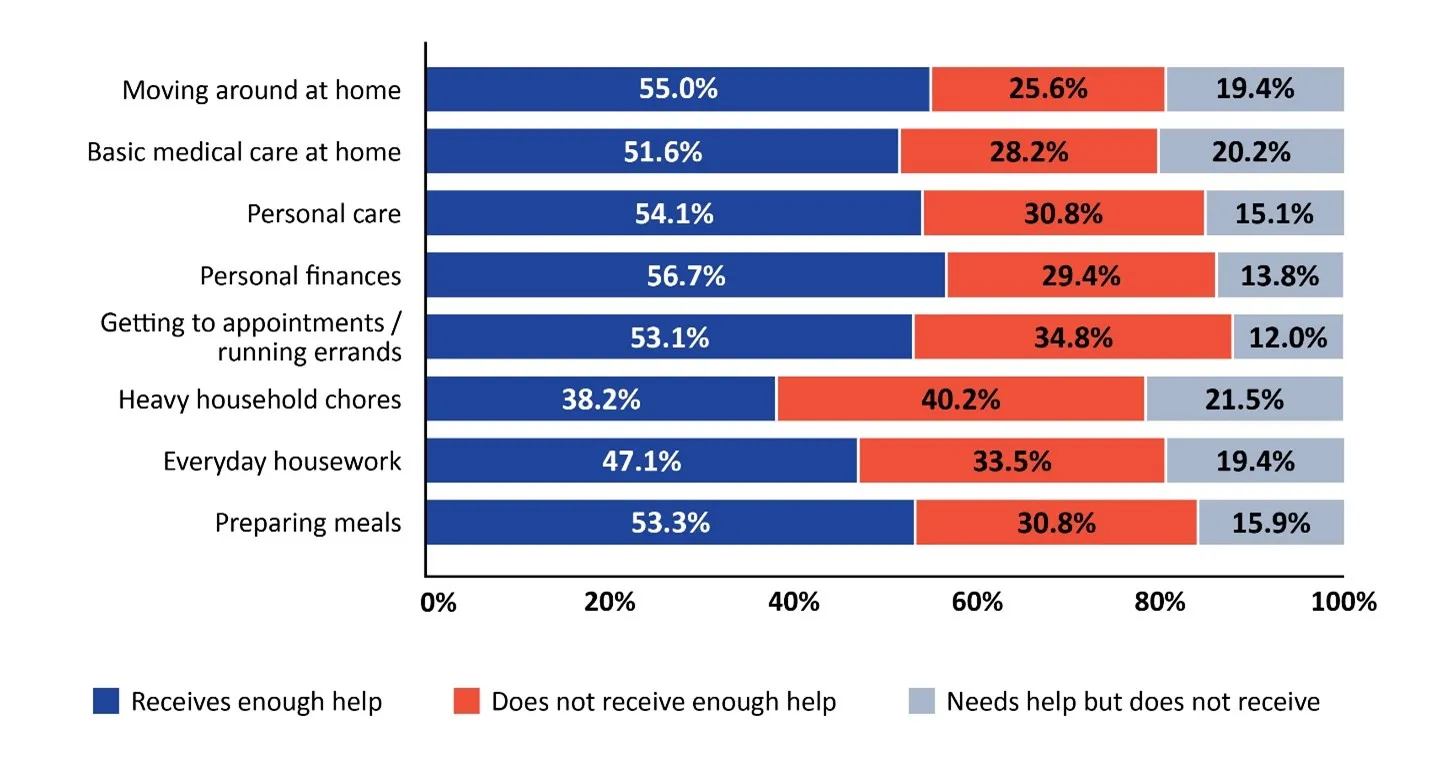
In 2022, people with disabilities most often needed help with the following tasks:
Heavy household chores (2,910,450 people)
Everyday housework (2,317,880 people)
Getting to appointments or running errands (2,131,790 people)
Preparing meals (1,699,970 people)
Personal finances (1,245,060 people)
Personal care (843,370 people)
Basic medical care at home (537,000 people)
Moving around their home (455,770 people)
See Chart 1 for more details.
Chart 1: Types of help received by people with disabilities
Image
Chart 1 - Text version
Receives enough help
Does not receive enough help
Needs help but does not receive
Moving around at home
55.0%
25.6%
19.4%
Basic medical care at home
51.6%
28.2%
20.2%
Personal care
54.1%
30.8%
15.1%
Personal finances
56.7%
29.4%
13.8%
Getting to appointments / running errands
53.1%
34.8%
12.0%
Heavy household chores
38.2%
40.2%
21.5%
Everyday housework
47.1%
33.5%
19.4%
Preparing meals
53.3%
30.8%
15.9%
People with disabilities are less likely to be satisfied with their ability to maintain a comfortable temperature at home. In 2021, 31% of people with disabilities (1,959,650 households) said they were dissatisfied with being able to maintain a comfortable temperature in the winter. This was compared to 20.8% of people without disabilities (1,819,250 households). About 35.5% of people with disabilities (2,243,500 households) said they were dissatisfied with being able to maintain a comfortable temperature in the summer. This was compared to 24.5% of people without disabilities (2,138,930 households).Footnote 19
The number of people with disabilities who had limited, or no internet access increased between 2017 and 2022. In 2017, about 1.7% of people with disabilities (20,570 people) said they never used the internet because they had limited or no internet access. In 2022, this increased to 6% (70,210 people).Footnote 20
Affordability
Goal:
People with disabilities have affordable housing. They are spending less than 30% of their income on housing.
What people told us:
People with disabilities told us there is not enough affordable housing, and the waitlists for affordable housing are very long. They said they sometimes have to live with strangers because they cannot afford to live alone.
“I make less than $15,000 a year, and $12,000 of it goes to my shelter. I live in constant fear of becoming homeless. I receive food from the food bank, but it's not enough. I can't afford my medications. I feel like my life will be cut short because of this.”
“Disability benefits are well below the poverty line, and housing frequently costs well over 50% of benefit income. The most affordable housing is renting a room in someone's home. This isn't suitable for people with health issues like PTSD, anxiety, autism and sleep issues. People are very choosy about who they'll rent a room to, and many landlords don't want you to have guests over.”
Results:
People with disabilities are almost twice as likely to live in core housing need than people without disabilities. In 2017, 15.9% of people with disabilities (956,480 people) lived in core housing need. This was compared to 8.1% of people without disabilities (1, 668,770 people). In 2022, 10.7% of people with disabilities (840,200 people) lived in core housing need. This was compared to 6.2% of people without disabilities (1,308,770 people).Footnote 21
As shown in Chart 2 and 3, people with disabilities are more likely to live in core housing need than people without disabilities across a variety of housing types. For example:
One in four people with disabilities living in subsidized housing was in core housing need. This is about 25.3% of people with disabilities.
One in five people with disabilities living in market rental housing (22%) were also in this situation.
Chart 2: People in core housing need (renter)
Image
Chart 2 - Text version
Total
Receives enough help
Does not receive enough help
Renters
16.8%
22.7%
14.1%
Renters in subsidized housing
23.8%
25.3%
22.5%
Renters not in subsidized housing
16.0%
22.2%
13.4%
Chart 3: People in core housing need (owner)
Image
Chart 3 - Text version
Total
People with disabilities
People without disabilities
Owners
3.9%
5.1%
3.5%
Owners with a mortgage
4.2%
5.7%
3.7%
Owners without a mortgage
3.4%
4.2%
3.1%
People with disabilities are more likely to live in unaffordable housing (i.e. housing those costs more than 30% of their income) than people without disabilities. This is the case for renters and owners, except for owners who live in housing owned by someone in their household.Footnote 22 See Chart 4 and 5 for more details.
Chart 4: People spending more than 30% of their income on housing (Renter)
Image
Chart 4 - Text version
Total
People with disabilities
People without disabilities
Renters
27.7%
33.7%
25.0%
Renters in subsidized housing
22.5%
25.4%
19.9%
Renters not in subsidized housing
28.3%
35.2%
25.4%
Chart 5: People spending more than 30% of their income on housing (Owner)
Image
Chart 5 - Text version
Total
People with disabilities
People without disabilities
Owners
11.9%
11.8%
12.0%
Owners with a mortgage
16.7%
17.2%
16.6%
Owners without a mortgage
3.6%
4.1%
3.4%
Renters with disabilities are almost three times as likely to live in unaffordable housing compared to owners. In 2017, 44.4% of renters with disabilities lived in unaffordable housing, compared to 15.6 % of owners with disabilities. In 2022, the numbers were 33.7% for renters with disabilities and 13.8% for owners with disabilities.Footnote 23
People with disabilities are more likely to skip or delay a housing payment, and more likely to miss housing payments due to financial difficulties. Based on 2021 data, one in ten people with disabilities (9.5% or 599,780 households) skipped or delayed a mortgage or rent payment in the last 12 months. This was compared to 6% of people without disabilities (527,610 households). About 91.9% of people with disabilities who skipped or delayed a housing payment said it was due to financial difficulties. This was compared to 88.5% of people without disabilities.Footnote 24
People with disabilities are more than twice as likely to have a household member on a waitlist for social and affordable housing. In 2021, about 2.5% of people with disabilities had at least one person on a waitlist for social and affordable housing (155,120 households). This was compared to 0.8% of households of people without disabilities (72,740 households).Footnote 25
Indigenous people with disabilities are more likely to be on waitlists for subsidized housing than Indigenous people without disabilities. In 2017, about 4.9% of Indigenous people with disabilities were on waitlists, compared to 3.3% of Indigenous people without disabilities.Footnote 26
Indigenous women with disabilities are more likely to be on waitlists for subsidized housing than Indigenous men with disabilities. In 2017, about 6.2% of Indigenous women with disabilities were on waitlists, compared to 5.8% of Indigenous men with disabilities.Footnote 27
Security of Tenure
Goal:
People with disabilities have security of tenure and access to justice. (They have stable housing, and they can't be forced out of their homes.)
What people told us:
People with disabilities told us they are at risk of being evicted by their landlords, and they face barriers in asserting their rights.
“My landlord decided to sell his property and evicted me in the fall of 2018. I lost my home and my reason for living. Life has been hellish ever since. It's over for me, but I am trying to advocate for younger people caught in this horrible situation.”
Results:
People with disabilities are more likely to be renters than people without disabilities. In 2017, 32.5% of people with disabilities were renters, compared to 24.9% of people without disabilities. In 2022, the percentages were 32.2% for people with disabilities and 27.9% for people without disabilities.Footnote 28
Many people with disabilities do not receive formal notices before being evicted. Based on 2021 data, two in five people with disabilities (42.8%) did not receive formal notice before being evicted. 42.2% people without disabilities did not receive formal notices.Footnote 29
“No-fault” evictions are the leading cause of forced moves in Canada. Among people who had been evicted, 68.9% (703,620 households) reported experiencing a “no fault” forced move. Among people with disabilities, the percentage is lower at 64.3% (368,480 respondents).Footnote 30
Safety
Goal:
People with disabilities feel safe in their homes and communities.
What people told us:
Many people with disabilities told us they feel unsafe at home and in their neighborhoods. This was especially true for women with disabilities.
“My neighborhood wasn't safe. The elevator frequently broke down and I didn't feel safe in the area or the building. I tried all the time to move to another neighborhood, but I couldn't.”
“Living on the street is tough. Women get sexually assaulted daily. It's unsafe.”
Results:
People with disabilities are less likely to feel safe at home than people without disabilities. In 2021, 16% of people with disabilities didn't feel safe at home, compared to 10% of people without disabilities.Footnote 31
Many people with disabilities do not feel safe when they leave their homes. In 2017, 29% of people with disabilities said they were housebound because they didn't feel safe leaving their homes. In 2022, this went down to 21%.Footnote 32
People with disabilities are more likely to experience hidden homelessness due to violence. Based on data from 2018, among people with disabilities who experienced hidden homelessness, 45% said it was due to fleeing violence. This was compared to 33% of people without disabilities.Footnote 33
More than half of women with disabilities who experienced hidden homelessness said it was due to violence or abuse. There was a particularly big difference between women with disabilities (54.5%) and men with disabilities (30.9%). See Chart 6 for more details.Footnote 34
Chart 6: People in temporary living situations due to abuse or violence
(by gender and disability status)
Image
Chart 6 - Text version
Men
Women
Total
25.1%
52.3%
People with disabilities
30.9%
54.5%
People without disabilities
18.8%
49.1%
Habitability
Goal:
People with disabilities can access housing that is big enough and in good condition.
What people told us:
“My front door doesn't lock. The furnace is broken, and the oven doesn't work. The landlord said we will be evicted if we ask for repairs. We can't afford to live anywhere else.”
“All I can afford is a room that has cockroaches and bedbugs. Waitlists for subsidized housing and co-ops have been full for years.”
Results:
People with disabilities are more likely to have pests in their homes than people without disabilities. In 2021, almost two in ten people with disabilities (18.3%) had had a pest infestation in the past 12 months. This was compared to 11.2% of people without disabilities.Footnote 35
Certain types of households are more likely to have pest infestations. This includes:
Single-person households (7.1% of people with disabilities, compared to 3.6% of people without disabilities);
Couples without dependents (3.7% of people with disabilities compared to 2% of people without disabilities); and
Single-parent households led by women (1.8% of people with disabilities, compared to 0.7% of people without disabilities).
People with disabilities are more likely to live in homes that need major repairs. The only exception is people with disabilities who live in subsidized housing. In 2022, almost one in ten people with disabilities (9%) lived in housing that needed major repairs. This was compared to around one in twenty people without disabilities (6%).Footnote 36
People with disabilities are more likely to have mould or mildew at home. In 2021, 1% of people with disabilities had issues with mould or mildew, compared to 0.2% of people without disabilities.Footnote 37
Indigenous people with disabilities are less likely to be satisfied with their housing due to mould or mildew at home than Indigenous people without disabilities. In 2017, 15% of Indigenous people with disabilities were not satisfied with their housing due to mould or mildew at home. This was compared to 14% of Indigenous people without disabilities.Footnote 38
Indigenous women with disabilities are less likely to be satisfied with their housing due to mould or mildew than Indigenous men with disabilities. In 2017, 17% of Indigenous women with disabilities were not satisfied with their housing for this reason. This was compared to 11% of Indigenous men with disabilities.Footnote 39
Location
Goal:
People with disabilities can live near their workplaces and the services they need. They live in neighborhoods that are free from pollution and other health risks.
What people told us:
Many people with disabilities told us they do not feel like they are part of their communities. People also said they live far from crucial services and supports.
“I live on the outskirts of town, and the nearest bus stop is too far for me to walk to. I can't afford a car, so I rely on friends for rides. This neighborhood has no sidewalks and the snow isn't cleared well in the winter, which makes it impossible for me to walk.”
“We were paying too much of our income for housing, so we had no choice but to move far away from the city. The transition was stressful. Our new place is far from my work and from daycare.”
Results:
People with disabilities are more likely to be dissatisfied with their communities than people without disabilities. In 2021, 14.3% of people with disabilities said they were dissatisfied with their communities. This was compared to 8.8% of people without disabilities.Footnote 40
People with disabilities saw a greater decline in their community satisfaction. In 2021, about 15.9% of people with disabilities reported a decrease in their community satisfaction in the last five years. This was compared to just 8.7% of people without disabilities.Footnote 41
People with disabilities are less likely to feel like part of their communities. In 2021, 66.4% of people with disabilities said they felt like part of their communities. This was compared to 81.1% of people without disabilities.Footnote 42
Many people with disabilities cannot access government services because of where they live and because transportation is not accessible. In 2017, 14.3% of people with disabilities (168, 680 people) could not access government services for these reasons.Footnote 43
Women with disabilities faced more barriers in accessing government services than men with disabilities. In 2017, 21% of women with disabilities faced these barriers. This was compared to 16.1% of men with disabilities.Footnote 44
Institutionalization
Goal:
People with disabilities are free to choose where and how they live. They can live independently in the community.
What people told us:
Many people with disabilities told us they are forced to live in institutions because there are no supports available in the community. They said people who are institutionalized don't get to make decisions about their daily lives, such as choosing who to live with, and what and when to eat. They told us that people with disabilities who have complex care needs should not be “warehoused” in nursing homes and other institutions.Footnote 45 They also said very little data is collected about people who live in institutions.
“I have a disability. I live in a bachelor apartment in a seniors' residence. I am not a senior, but they put me here. I have had issues with the staff, including harassment, poor communication, violence and just plain ignorance when it comes to dealing with my issues.”
“The state of long-term care in Canada scares the life out of me. I would likely consider medical assistance in dying (MAID) before entering a long-term care facility in the future.”
Results:
Thousands of people under age 55 are institutionalized in long-term care homes. In 2016, 7405 people under age 55 lived in nursing and seniors' homes. In 2021, this number was 7590 people.Footnote 46 Since long-term care homes are primarily designed for older people (i.e. seniors), they are not an appropriate housing option for young people with disabilities.
Tens of thousands of people with disabilities are institutionalized in group homes. In 2016, 65 790 people lived in group homes for people with disabilities and addictions. In 2021, this number was 61 710 people.Footnote 47
We identified several significant data gaps through this project. For example, the following groups of people with disabilities are excluded from many national surveys:
People living in institutions, such as group homes, hospitals and prisons;Footnote 49
People experiencing homelessness and hidden homelessness;Footnote 50
Some types of disabilities are not counted as disabilities in national surveys;Footnote 54
Some surveys focus primarily on physical disabilities;Footnote 55
Some surveys don't ask whether people have disabilities;Footnote 56 and
Survey data isn't always disaggregated, which makes it difficult to identify whether certain people with disabilities (e.g. Black, Indigenous and Racialized and/or, gender-diverse people) face additional barriers.Footnote 57
We developed recommendations to help advance the right to adequate housing for people with disabilities in Canada. These recommendations are based on our monitoring framework results, our engagement with disability communities, and the Advocate's reviews of systemic housing issues. We call on governments in Canada to take the following actions:
Meet Canada's obligations under Canadian and international law to respect, protect and fulfill the human rights of people with disabilities.
Ensure substantive follow up on the concluding observations and recommendations from the UN Committee for the Rights of Persons with Disabilities when Canada is reviewed under the CRPD in 2025.
Formally recognize and promote the human right to adequate housing across all levels of government.
Recognize that this right is justiciable (i.e. courts and administrative tribunals can make decisions about it) and stop trying to limit this right in court.
Establish and adequately fund independent systems to monitor and review systemic right to housing issues (e.g. human rights commissions, ombudspersons and advocates).
Apply the principle of “nothing without us”.
Involve people with disabilities when developing housing-related laws, regulations, policies and programs, including building codes. This will help ensure these measures are inclusive and accessible, and they meet the diverse needs of disability communities.
Improve cross-government coordination and collaboration to advance the right to adequate housing for people with disabilities.
Prevent discrimination and ableism by raising awareness about the rights of people with disabilities, including their right to adequate housing.
Provide disability rights training for building code developers, architects, builders, developers, landlords and other housing providers, administrative decision-makers (e.g. landlord-tenant tribunal members) and service providers.
Require that all officials with responsibilities related to housing and homelessness receive training on disability rights, the right to adequate housing, Anti-Racism, Gender-based Analysis (GBA) Plus and the UN Declaration on the Rights of Indigenous Peoples.
Prevent the institutionalization of people with disabilities and ensure their autonomy over their living situations. This includes providing people with disabilities with adequate supports to enable them to live in the community with dignity and independence.
Provide additional community-based supports for people with disabilities, such as assistance for bathing, cooking and cleaning, as well as mental health, substance use and social supports.
Improve monitoring and oversight of institutions that house people with disabilities, including mental health facilities and long-term care homes.
Ratify and effectively implement the Optional Protocol to the Convention against Torture.
Enhance financial supports for people with disabilities to ensure they provide an adequate standard of living and enable people to live with dignity.
Ensure financial supports keep pace with cost-of-living increases, cover housing costs, allow people to meet their basic needs, and cover additional disability-related expenses.
Significantly increase the amount of the new Canada Disability Benefit (CDB), and prevent reductions in other disability benefits for people who receive the CDB.Footnote 59
Increase the supply of accessible housing by strengthening accessibility requirements in Canada's building codes. These codes must respect Canadian and international human rights laws, and ensure that all new housing is barrier-free.
Expand funding programs for accessibility-related home adaptations, including the federal Home Accessibility Tax Credit.
Make housing more affordable by providing additional subsidized and non-market housing, and by establishing rent and vacancy control measures.
Strengthen legal protections for tenants with disabilities and improve access to justice.
Remove barriers in the legal system and provide supports for people with disabilities to exercise their rights. For example, provide legal information in plain language, and additional funding for people to hire lawyers.
Formally adopt and promote the Renter Bill of Rights and ensure that it specifically meets the needs of people with disabilities.
Ensure that evictions are only used as a last resort, and that people aren't evicted into homelessness.
Prioritize the health and safety of people with disabilities.
Enhance supports and services for people experiencing or fleeing violence and abuse.
Ensure that emergency plans, including building evacuation plans, address the needs of people with disabilities.
To address the data gaps we identified through our monitoring framework, Canada should:
Meaningfully involve people with disabilities when developing surveys and collecting and analyzing survey data.
Include all people with disabilities in national surveys, including people living in various types of institutions, people experiencing homelessness, children with disabilities, people in Northern and rural areas, and First Nations people on reserves.
Ensure that all surveys identify people with disabilities in the same way (e.g. by using Statistics Canada's Disability Screening Questions).
Disaggregate all survey data to facilitate the identification of additional barriers facing certain marginalized groups.
Collect comprehensive data on the supply of and demand for accessible and affordable housing in Canada.
Conclusion
Our monitoring framework results clearly show that Canada must act now to improve housing outcomes for people with disabilities. These results will serve as a baseline for the OFHA and CHRC to continue monitoring the right to adequate housing for people with disabilities. These results should inform evidence-based policymaking in Canada, including improved data collection. We invite people with disabilities, advocates and experts to use these results to advocate for change. Our monitoring framework could be adapted to monitor other rights in the CRPD, or to monitor the right to adequate housing for other marginalized groups. We will publish additional results from this project in 2025 and will continue working to advance the right to adequate housing for people with disabilities in Canada.
Annex 1: List of Acronyms
CCPIS
Canada's Core Public Infrastructure Survey
CHRC
Canadian Human Rights Commission
CHS
Canadian Housing Survey
CRPD
Convention on the Rights of Persons with Disabilities
CSD
Canadian Survey on Disability
IPS
Indigenous Peoples Survey
OFHA
Office of the Federal Housing Advocate
SSPPS
Survey of Safety in Public and Private Spaces
Annex 2: List of Charts
Chart 1:
Types of help received by people with disabilities
Chart 2:
People in core housing need (Renter)
Chart 3:
People in core housing need (Owner)
Chart 4:
People spending more than 30% of their income on housing (Renter)
Chart 5:
People spending more than 30% of their income on housing (Owner)
Chart 6:
People in temporary living situations due to abuse or violence (by gender and disability
status)