Roadblocks on the career path: Challenges faced by persons with disabilities in employment
Executive Summary
It is widely accepted that a person's well-being, good health and social inclusion is directly linked to their employment. A key indicator of one's quality of life and sense of personal fulfillment is one's ability to be gainfully employed and to find meaningful work.
Yet, as this report shows, persons with disabilities continue to face barriers and stigma when looking for work, when seeking workplace accommodation and when trying to thrive or advance in their careers. Though these findings may not be surprising for many people living in Canada, that doesn't make the gravity of them any less concerning. For example:
- At the national level, the employment rates of both women (45%) and men (49.8%) with disabilities are substantially lower compared to those of women (70.1%) and men (77.1%) without disabilities.
- More than 30% of persons with disabilities report that their disability makes it difficult for them to change jobs or advance in their careers.
- Across Canada, nearly 30% of persons with disabilities report having asked for workplace accommodation that was not made available.
Even more at odds with Canada's values of inclusion and diversity is the finding that a proportion of at least 40% of persons with disabilities report feeling that their employer considers them disadvantaged because of their disability.
This report is the third and last report in the Canadian Human Rights Commission's series of reports on Canada's implementation of the United Nations Convention on the Rights of Persons with Disabilities (UNCRPD). The Commission worked in close collaboration with provincial and territorial human rights commissions and/or tribunals across Canada to arrive at these findings.
Background
The United Nations Convention on the Rights of Persons with Disabilities (UNCRPD) was adopted by the UN General Assembly on December 13, 2006, and came into force on May 3, 2008. Its purpose is to promote, protect and ensure the full and equal enjoyment of all human rights and fundamental freedoms by all persons with disabilities. It also promotes respect for their inherent dignity. States that ratify the UNCRPD are required to report to the Committee on the Rights of Persons with Disabilities on its implementation.1 The Committee reviews each State report; develops a list of issues and asks for additional information as needed; and makes recommendations.
In addition, the Committee invites National Human Rights Institutions (NHRIs) and organizations representing civil society — particularly those representing persons with disabilities — to respond to the reports of State parties. Canada, which ratified the UNCRPD in 2010, submitted its first report to the Committee in 2014. It outlined specific measures adopted by federal, provincial and territorial governments aimed at providing support to persons with disabilities and their families as well as promoting their inclusion and full participation in Canadian society.2 In April 2017, the Committee reviewed Canada's report and adopted concluding observations that contain a series of recommendations. These include recommendations that specifically address the employment of persons with disabilities.
The rights of persons with disabilities in Canada
In Canada, the rights of persons with disabilities are enshrined in the Canadian Human Rights Act, in provincial and territorial human rights codes, and in the Canadian Charter of Rights and Freedoms.
As well, the UNCRPD is implemented in Canada through constitutional and statutory protections, as well as legislative, administrative and other measures, including:
- The Canadian Charter of Rights and Freedoms, which applies to all government actions and guarantees all individuals fundamental freedoms and rights, including an explicit equality rights guarantee for persons with disabilities; and
- Federal, territorial and provincial human rights laws, which apply to the public and private sectors and prohibit discrimination on grounds such as disability in regard to employment, the provision of goods, services and facilities customarily available to the public, and accommodation.3
Persons with disabilities can bring a discrimination complaint before federal, territorial and provincial independent human rights commissions and tribunals or courts to enforce their rights.
The Canadian Association of Statutory Human Rights Agencies (CASHRA) is an umbrella organization that fosters collaboration between Canada's federal, provincial and territorial human rights commissions. One of its key priorities is the protection of the rights of persons with disabilities in Canada. CASHRA has established a UNCRPD working group to coordinate related activities.4
Monitoring the UNCRPD and National Human Rights Institutions: Article 33
As outlined above, States that ratify the UNCRPD are required to report to the UN on its implementation. Article 33 of the UNCRPD is unique. According to the UN Office of the High Commissioner for Human Rights, “it is arguably the most complete provision on national level implementation and monitoring ever in an international human rights treaty.”5
Article 33.1 of the UNCRPD states that one or more focal points within government shall be designated for matters relating to the implementation of the UNCRPD. In addition, Article 33.2 of the UNCRPD requires ratifying states to have an internal framework that includes one or more independent mechanisms, such as a NHRI, in order to promote, protect and monitor the implementation of the UNCRPD. Article 33.3 provides for the full participation of civil society, particularly for persons with disabilities and their representative organizations.
In order to implement the Article, some states, such as Australia, have designated their NHRI as their independent mechanism. Other states, such as New Zealand, have designated an independent mechanism that includes their NHRI and other organizations. In the case of New Zealand, the New Zealand Human Rights Commission, the Office of the Ombudsman, and the Disability Convention Coalition have joint responsibilities as the state's independent mechanism.
CHRC series of reports on Canada's implementation of the UNCRPD
In collaboration with CASHRA and organizations representing persons with disabilities, the CHRC is in the midst of developing a series of interim reports on Canada's implementation of the UNCRPD—specifically the rights provided for in Article 5, Equality and Non-discrimination.6 This report is the third and last report in the series.
While the focus of these reports is on the rights to equality and non-discrimination, they also touch on other rights of persons with disabilities provided for in other articles of the UNCRPD, such as Article 24 on Education and Article 27 on Work and Employment. These reports will also be used as benchmarks to monitor the implementation of the UNCRPD over time—an approach that the UNCRPD Secretariat notes is particularly effective in monitoring implementation.7
The first report entitled, The Rights of Persons with Disabilities to Equality and NonDiscrimination: Monitoring the Implementation of the UN Convention of the Rights of Persons with Disabilities in Canada, was published in December 2015. The objective of this first report was to better understand the experiences of discrimination by persons with disabilities across Canada. The report was the first of its kind, bringing together data on disability-related complaints received from 2009 to 2013 across all the federal, provincial and territorial human rights commissions and/or tribunals.
The second report entitled, Left Out: Challenges faced by persons with disabilities in Canada's schools, was published in March 2017. Using data from the 2012 Canada Survey on Disability and information gathered during consultations with provincial and territorial human rights commissions and stakeholders who work closely with persons with disabilities, the objective of this second report was to better understand the educational experiences of persons with disabilities across Canada and to identify the barriers and challenges they are facing when it comes to their education.
The objective of this third and final report is to better understand the employment experiences of persons with disabilities across Canada. The report brings together provides descriptive statistics on selected employment-related indicators using the 2012 Canada Survey on Disability.
Methodology and method of analysis
In order to have a more complete picture on the employment-related experiences of persons with disabilities, the Canadian Human Rights Commission (Commission) consulted with most human rights commissions and/or tribunals across Canada. Each organization was invited to provide data, and any additional information, on the number of disability and non-disability related complaints they received from 2009 to 2016, broken down in two categories: employment-related and non-employment related. The data can be found in Annex A.
The source of federal complaints data comes from the Commission. Provincial and territorial complaints data was provided by Prince Edward Island, Nova Scotia, New Brunswick, Quebec, Alberta and Yukon commissions. Data for Ontario was provided by the Human Rights Tribunal of Ontario. Newfoundland and Labrador and North West Territories were only able to provide overall data on disability complaints, without being able to break down the information by employment-related and non-employment related complaints. Saskatchewan was not able to provide any data. British Columbia and Nunavut did not participate in the study.
The Commission also engaged with various organizations and experts that represent persons with disabilities in Canada,8 who were invited to share any relevant expertise related to employment and discrimination.
Statistical analysis on various employment-related indicators was done using the 2012 Canadian Survey on Disability (CSD). The CSD gathers information about Canadian adults, aged 15 and over, who report having a disability. The survey collects information on various topics, including type and severity of disability, labour force status, educational attainment, experiences and accommodations at school or work.
Descriptive statistics are used to compare the situation of women and men with and without disabilities in terms of their employment experiences. Statistical tests were run on all comparisons to determine if differences were statistically significant at the 0.05 level. Where differences are not significant, this is noted in the table. In addition, the coefficient of variation (CV) was used to assess the reliability of the estimates.9
Finally, the report was reviewed by each jurisdiction that was initially consulted. They were invited to review the content presented in this report and to provide any additional information that may not be reflected in the statistical analysis. The views expressed in this report are those of the Commission and participating organizations in the Canadian Association of Statutory Human Rights Agencies' United Nations Convention on the Rights of Persons with Disabilities working group.
Limitations
There are limitations associated with using disability-related complaints data from various human rights jurisdictions in Canada. First, there are no consistent methods of gathering complaints data across Canada's human rights commissions and/or tribunals. For example, each jurisdiction has its own definition of disability and uses different keywords to count their disability-related complaints. In addition, complaints are not gathered using the same time frame. For example, some jurisdictions use the fiscal year (from April 1 to March 31), while others use the calendar year (from January 1 to December 31). These differences make it difficult to make comparisons across jurisdictions.
Second, some jurisdictions deal with a small number of complaints and an even smaller number of disability-related complaints each year, making it difficult to analyze the evolution of these complaints over a specific period of time. In addition, when the number of complaints is small, fluctuations in the data might seem artificially high.
There are also limitations associated with using national surveys. People living on First Nations reserves as well as people living in collective dwellings were excluded from the sampling coverage. These exclusions may have led to an underestimation of the prevalence of disability.
In addition, on some occasions, sample sizes were so low that some variables and measures had to be dropped to protect the identity of the respondents, in accordance with Statistics Canada confidentiality requirements. On other occasions, responses to some questions were aggregated. For example, the variable of “sex” had to be aggregated for some measures. In addition, in some instances, Newfoundland and Labrador, Prince Edward Island, Nova Scotia and New-Brunswick had to be aggregated under “Atlantic provinces” and Yukon, Northwest Territories and Nunavut had to be aggregated under “territories.” Other indicators were dropped because the value of the CV was too high—which means there was too much uncertainty with the accuracy associated with the estimates.
Finally, it is important to note that differences documented in this report do not necessarily indicate discrimination as defined in human rights law. A number of other factors may account for the differences. However, the differences may point to areas for further study and intervention as these may be tied to potential discrimination. In addition, this report provides only a descriptive picture of what people with disabilities reported. This means that in some cases, outcomes in this report are not necessarily linked to disability. More in depth research needs to be conducted in order to better understand the relationships, if any, between disability and the outcomes reported by the respondents.
Snapshot of disability in Canada10
An estimated 3.8 million Canadian adults reported having some type of disability. This represents 13.7% of the Canadian population. At the provincial level, the prevalence of disability ranges from as low as 6.9% in Nunavut, to as high as 18.8% in Nova Scotia (see Chart 1.)
Disability rates vary between women and men and across age groups. At the national level, 14.9% of women and 12.5% men have a disability. The disability rates for both women and men progressively increases with age, where it reaches 44.5% for women aged 75+ and 39.8% for men of the same age group. In addition, the disability rate for women is higher than that of men in each age group, with the exception of people aged 15-24. Similar results can be seen at the provincial level, where the disability rate for adult women aged 15+ is higher than that of adult men aged 15+. In addition, the disability rate of both women and men increases as their age increases, where it reaches 50% and plus for women aged 75+ living in Yukon, Northwest Territories and Nunavut (see Table 20.)
Employment and persons with disabilities
It is widely known and accepted that long-term employment and a person's overall wellbeing are linked. Employment is also an important indicator of social inclusion. It is also used by others as a way to evaluate the contribution that person makes to society. Being employed can promote good mental health in that it offers one a place to socialize, to develop interpersonal contacts, to use one's skills, and to gain a sense of personal accomplishment and esteem.11
And yet in Canada, persons with disabilities are still facing barriers and stigma while trying to gain employment. These barriers and stigma may prevent persons with disabilities from participating in the labour force or from finding meaningful employment that is linked to their educational attainment. Once employed, it can be quite challenging for persons with disabilities to stay employed. The barriers and stigma persons with disabilities face in employment may result in a lack of workplace accommodation they need to best perform in their job, and even limit their opportunities for advancement in their careers.
Reported experience by persons with disabilities in Canada12
This section presents descriptive statistics from the 2012 Canada Disability Survey on the employment-related experiences reported by persons with disabilities.
Key Finding 1: Employment rates of persons with disabilities aged 15 to 64 are substantially lower than those of persons without disabilities – Table 21
The employment rates for persons with disabilities aged 15 to 64 are substantially lower than those of persons without disabilities across Canada. For example, at the national level, the employment rates of both women (45%) and men (49.8%) with disabilities are substantially lower compared to those of women (70.1%) and men (77.1%) without disabilities. The one exception is in Nunavut however, where the employment rate for persons with disabilities is only slightly lower compared to persons without disabilities (55.5% vs. 54.1%).
Similarly, at the provincial and territorial level, employment rates for women with disabilities are much lower than women without disabilities. The employment rates for women with disabilities are the lowest in Newfoundland and Labrador (33.5%), while they reach over 40% in New Brunswick, Quebec, Nunavut, Nova Scotia, Ontario, British Columbia and Prince Edward Island. The employment rates for women with disabilities reach over 50% in the Northwest Territories, Manitoba, Alberta, Yukon and Saskatchewan. Differences in employment rates between women with and without disabilities vary from approximately 11% to 30%. The largest differences are seen in Quebec (28.7%) and in New Brunswick (28.5%).
For men with disabilities, the employment rates are the lowest in Quebec (38.2%), while they surpass 40% in New Brunswick, Newfoundland and Labrador and Ontario. Those rates are over 50% in the Northwest Territories, British Columbia, Prince Edward Island and Nova Scotia. The rates surpass 60% in Manitoba, Yukon, Saskatchewan, Alberta and Nunavut. Differences in employment rates between men with and without disabilities vary from approximately 15% to 40% across all provinces and territories. The largest differences are seen in Quebec (37.5%) and New Brunswick (32%). An interesting note is that the employment rates of men with disabilities in Nunavut are higher than that of men without disabilities (69.2% vs. 54.3%).
Among persons with disabilities aged 15 to 64, the employment rates of women are lower than those of men across all provinces and territories. The only exceptions are seen in Quebec and in the Northwest Territories where the employment rates of women with disabilities are slightly higher compared to men with disabilities. The largest differences in employment rates are seen in Nunavut (26.8%) and in Newfoundland and Labrador (14.4%).
Key Finding 2: Women with disabilities aged 15+ are more likely to work in parttime employment compared to men with disabilities – Table 22
Persons with disabilities are more likely to work part-time compared to persons without disabilities across Canada. At the national level, the proportion of women and men with disabilities working part-time is respectively 32% and 24.7% compared to 28.4% and 14.6% for women and men without disabilities.
The proportions of women with disabilities who work part-time vary from 20% to 30% in the territories and in Ontario. The proportions reach more than 30% in Saskatchewan, Alberta, Manitoba, Quebec, in the Atlantic provinces, and in British Columbia. Women with disabilities are more likely to work part-time compared to women without disabilities across all provinces, with the exception of Ontario. The largest differences are seen in the Atlantic provinces (10.5%) and in Quebec (9.4%).
By comparison, the proportions of men with disabilities who work part-time are below 20% in the Atlantic provinces and Alberta. The proportions reach more than 20% in the territories, Quebec, Manitoba, Saskatchewan and Ontario, and reaches just over 30% in British Columbia. As found with women, men with disabilities are more likely to work part-time compared to men without disabilities across all provinces and the territories. The largest differences are seen in British Colombia (14.6%), Saskatchewan (12.9%) and Ontario (10.8%).
With the exception of the territories, women with disabilities are more likely to work parttime than men with disabilities across Canada. The largest differences are seen in the Atlantic provinces (18.9%), Alberta (15.2%), Quebec (12.9%) and Manitoba (12.2%).
Key Finding 3: A proportion of more than 30% of persons with disabilities aged 15+ consider themselves disadvantaged in employment because of their condition – Table 23
Across Canada, more than 30% of persons with disabilities consider themselves disadvantaged in employment because of their condition. The proportion of women with disabilities who report the same reaches over 40% in Ontario and British Columbia. As for men with disabilities, the proportion reaches over 40% in British Columbia, Ontario and Quebec. The largest difference is seen in Quebec where men with disabilities are substantially more likely to consider themselves disadvantaged in employment because of their disability compared to women with disabilities (44.9% vs. 35%).
Key finding 4: In most provinces, a proportion of more than 40% of persons with disabilities aged 15+ believe that their current or any potential employers would likely consider them disadvantaged in employment because of their disability – Table 24
With the exception of Alberta and the territories, at least 40% of persons with disabilities believe that their current or any potential employers would likely consider them disadvantaged in employment because of their disability. The proportion of women with disabilities who report the same is over 40% in Quebec, Saskatchewan, British Columbia and Ontario, while it is substantially lower in the territories (23.9%). The proportion of men with disabilities is more than 40% across all provinces, and is slightly lower in the territories at 36.6%. The largest difference is seen in the territories where the proportion of men with disabilities is 36.6% compared to 23.9% for women with disabilities.
Key Finding 5: More than 30% of persons with disabilities aged 15+ report that their disability makes it difficult or very difficult to change/advance in their job – Table 25
At the national level, 44.6% of women with disabilities report that their disability makes it difficult or very difficult to change/advance in their job compared to 46.7% for men with disabilities. The proportion of women with disabilities who report the same is more than 30% in Manitoba, Alberta, Saskatchewan, and in the territories. The proportion reaches more than 40% in British Columbia, Ontario, Quebec and the Atlantic provinces.
More than 30% of men with disabilities in British Columbia, Saskatchewan and in the territories report that their disability makes it difficult or very difficult to change/advance in their job. The proportion reaches more than 40% in Manitoba, Ontario and in Alberta and reaches more than 50% in the Atlantic provinces and in Quebec. Women with disabilities in Manitoba, Alberta and in Quebec are substantially less likely to report that their disability makes it difficult or very difficult to change/advance in their job compared to men with disabilities. On the other hand, women with disabilities living in British Columbia are substantially more likely to report the same compared to men with disabilities.
Key Finding 6: Approximately 30% of persons with disabilities aged 15+ who asked for workplace accommodation that was not made available – Table 26
Across Canada, nearly 30% of men and women with disabilities report having asked for workplace accommodation that was not made available. The proportion for women with disabilities is 27.8% compared to 32.5%E for men with disabilities.
Key Finding 7: Approximately 10% of persons with disabilities living in Alberta and British Columbia report being refused a job promotion – Table 27
At the national level, 8.3% of men and 7.5% of women with disabilities report being refused a job promotion. The proportion of women with disabilities who report having been refused a job promotion is the lowest in the Atlantic provinces (4.8%E) while the highest proportions are seen in British Columbia (9.2% E) and in the territories (9.3% E). The highest proportion of men with disabilities who report having been refused a job promotion is in British Columbia (9.6% E) and Alberta (10.8% E), while the lowest is in Quebec (4.6% E).
Key Finding 8: Approximately one in five adults with disabilities aged 15+ report changing jobs because of their disability – Table 28
At the national level, a proportion of 23.1% of persons with disabilities report changing jobs because of their disability. At the provincial and territorial level, the proportion of persons with disabilities who report changing jobs because of their disability varies from approximately 21% to 26%. The only exception is seen in Alberta where the proportion of persons with disabilities who report the same is 32.8%. In Alberta, the proportion of women with disabilities who report changing jobs because of their disability is substantially lower compared to men with disabilities (19.2% vs. 32.8%).
Key Finding 9: Women with disabilities aged 15+ are more likely to report changing the amount of work they do because of their disability – Table 29
Women with disabilities in most parts of Canada are more likely to report changing the amount of work they do because of their disability compared to men with disabilities. For example, at the national level, the proportion of women with disabilities who report changing the amount of work they do because of their disability is 38% compared to 34.6% for men with disabilities. The proportion of women with disabilities who report the same is in the 30% in the territories, Alberta, the Atlantic provinces, Quebec and Ontario. The proportions reach more than 40% in British Columbia, Manitoba and Saskatchewan. The proportion of men with disabilities who report the same is in the 30% across all provinces and the territories, with the exception of British Columbia, where it reaches slightly over 40%.
Key Finding 10: More than one out of five of persons with disabilities aged 15+ are more likely to report changing their kind of work because of their disability – Table 30
At the national level, the proportion of men with disabilities who report changing their kind of work because of their disability is 31.8% compared to 28.8% for women with disabilities. At the provincial level, with the exception of British Columbia, men with disabilities are more likely to report the same across all provinces and the territories. The proportion of women with disabilities who report the same is more than 20% across all provinces and territories. The proportion is even higher in Saskatchewan, where it reaches 30%, and in British Columbia, where it reaches 38.4%. On the other hand, the proportion of men with disabilities who report changing the kind of work they do because of their disability is approximately 30% across all provinces and the territories. The proportion reaches approximately 35% in both Alberta and Saskatchewan.
Key Finding 11: With the exception of British Columbia, men with disabilities aged 15+ are more likely to report that their disability limits the amount/kind of work that they can do compared to women with disabilities across Canada – Table 31
At the national level, a proportion of 44.3% of women with disabilities aged 15+ report that their disability limits the amount/kind of work that they can do compared to 45.8% for men with disabilities. The proportion of women with disabilities who report the same is more than 30% in the territories and just under 40% in Quebec. The proportion reaches more than 40% in Ontario, the Atlantic provinces, Saskatchewan and Manitoba. A proportion of just over 55% of women with disabilities in Alberta report that their disability limits the amount/kind of work that they can do. The proportions of men with disabilities who report the same are at least 40% across all provinces and the territories, with the exception of Saskatchewan where the proportion reaches 54%.
Key Finding 12: In general, men with disabilities aged 15+ are more likely to report having been refused a job interview or a job compared to women with disabilities – Tables 32 and 33
With the exception of Ontario and the territories, a slightly higher proportion of men with disabilities across Canada are more likely to report having been refused a job interview than women. For example, at the national level, 8% of men with disabilities report this compared to 7.4% of women with disabilities.
Similar results are seen for persons with disabilities who report being refused a job. With the exception of Ontario and the territories, a slightly higher proportion of men with disabilities across Canada are more likely to report having been refused a job than women with disabilities. The proportion of women with disabilities who report having been refused a job is below 10% in the Atlantic provinces and in British Columbia, while it varies between 10% and 12% in the other provinces and the territories. On the other hand, the proportion of men with disabilities who report the same is consistently more than 10% across all provinces and the territories. The proportion is especially high in Quebec (16.9%E) and Manitoba (17.9%).
Conclusion
Persons with disabilities in Canada do not have an equal chance as other people in Canada to thrive or advance in their careers. This is in contradiction to Article 27 of the UNCRPD. A significant proportion of persons with disabilities are facing physical and attitudinal barriers in employment across the country.
Many different employment-related barriers are reported by persons with disabilities. For example, at least 30% of persons with disabilities report that they feel disadvantaged in employment because of their disability. In addition, approximately 40% report feeling that their employer considers them disadvantaged because of their disability. Approximately 30% of women and men with disabilities asked for workplace accommodation that was not made available.
These findings raise many questions for future research to better understand the impact of disability on one's labour force participation. For example, we recognize that discrimination and its impact on a person's career path may vary depending on the type and severity of their disability.. Additional research may deepen our understanding of these experiences. Additional research is also needed to better understand the long term impacts of workplace discrimination, stigma and harassment for persons with disabilities in the workforce.
This report underscores the need for greater action to remove barriers and promote employment for persons with disabilities. The federal government's development of federal accessibility legislation is an important step to proactively addressing and removing barriers to employment for persons with disabilities.
Bibliography
C
Canadian Association of Statutory Human Rights Agencies and Ontario Human Rights Commissions (2011). Canada and the UN Convention on the Rights of Persons with Disabilities.
Canada (2014). Convention on the Rights of Persons with Disabilities: First Report of Canada. .
Canada (2015). The Rights of Persons with Disabilities to Equality and NonDiscrimination: Monitoring the Implementation of the UN Convention of the Rights of Persons with Disabilities in Canada. Canadian Human Rights Commission. .
Canada (2016). Left out: Challenges faced by persons with disabilities in Canada. Canadian Human Rights Commission. .
Canada (2015). A profile of persons with disabilities among Canadians aged 15 years or older, 2012. Statistics Canada. .
T
Thornicroft, Graham. Shunned: Discrimination Against People with Mental Illness. Oxford University Press, 2006.
U
United Nations (2006). Convention on the Rights of Persons with Disabilities. Treaty Series. Vol. 2515.
United Nations (2014). Convention on the Rights of Persons with Disabilities: National implementation and monitory. CRPD/CSP/2014/3. Conference of State Parties to the Convention on the Rights of Persons with Disabilities. Seventh Edition.
United Nations Human Rights Office of the High Commissioner (2014). Study on the implementation of Article 33 of the UN Convention on the Rights of Persons with Disabilities in Europe.
United Nations (2017). Convention on the Rights of Persons with Disabilities. Committee on the Rights of Persons with Disabilities. Concluding observations on the initial report of Canada. CRPD/C/CAN/CO/1.
Annex A: Tables showing disability complaints related to employment received by human rights jurisdictions across Canada, from 2009 to 2016
Across nearly all human rights commissions and/or tribunals in Canada, human rights complaints related to disability comprise nearly 50% of the total complaints received between 2009 and 2016. At the federal level, the proportion of disability-related complaints received by the Canadian Human Rights Commission is 52.4%.
At the provincial and territorial level the proportion was highest for the Nova Scotia Human Rights Commission, for which 64.6% of the total complaints are disabilityrelated. The Newfoundland and Labrador Human Rights Commission and the Human Rights Tribunal of Ontario have the second-highest proportions of disability related complaints. The lowest proportion of disability-related complaints received is seen at the New Brunswick Human Rights Commission (36.5%) and at the Commission des droits de la personne et des droits de la jeunesse du Quebec (32.9%)
Some common examples of disability complaints related to employment include a lack of physical workplace accommodation, a failure to facilitate a return to work process and a failure to approve a medical absence. In addition, many other complainants allege that the accommodation measures proposed and/or implemented by an employer are inadequate to address their medical limitations.
| Jurisdiction | Proportion and number of disability-related complaints | Proportion of total complaints that are disability complaints related to employment | Proportion of total disability complaints that are related to employment |
|---|---|---|---|
| Canadian Human Rights Commission | 52.4% (4538) | 44.1% | 84.1% |
| Newfoundland and Labrador Human Rights Commission | 53.1% (251) | N/A | N/A |
| Prince Edward Island Human Rights Commission | 44.8% (188) | 30.5% | 68.1% |
| Nova Scotia Human Rights Commission | 64.6% (1109) | 51.9% | 80.3% |
| New Brunswick Human Rights Commission | 36.5% (461) | 30.1% | 82.6% |
| Commission des droits de la personne et des droits de la jeunesse du Quebec | 32.9% (2014) | 16.7% | 50.8% |
| Human Rights Tribunal of Ontario | 52.3% (11573) | 38.2% | 73.1% |
| Manitoba Human Rights Commission | 44.1% (962) | 29.0% | 65.6% |
| Alberta Human Rights Commission | 49.1% (6885) | 43.3% | 88.1% |
| Northwest Territories Human Rights Commission | 47.5% (86) | N/A | N/A |
| Yukon Human Rights Commission | 48.8% (100) | 27.8% | 57.0% |
Complaints are compiled either by calendar year of fiscal year.
All percentages are rounded to one decimal point.
Canadian Human Rights Commission
| Fiscal year | Proportion of disability complaints on the total complaints | Proportion of employment-related complaints on the total complaints |
|---|---|---|
| 2009-10 | 51.3% | 82.6% |
| 2010-11 | 50.5% | 81.6% |
| 2011-12 | 45.9% | 81.1% |
| 2012-13 | 50.3% | 78.7% |
| 2013-14 | 57.0% | 76.0% |
| 2014-15 | 57.6% | 76.4% |
| 2015-16 | 58.3% | 73.2% |
All percentages are rounded to one decimal point.
| Fiscal year | Proportion of disability complaints related to employment on the total complaints | Proportion of disability complaints related to employment on the total of disability complaints |
|---|---|---|
| 2009-10 | 45.0% | 87.7% |
| 2010-11 | 43.3% | 85.6% |
| 2012-13 | 42.1% | 83.7% |
| 2013-14 | 46.2% | 81.0% |
| 2014-15 | 48.0% | 83.3% |
| 2015-16 | 48.1% | 82.5% |
All percentages are rounded to one decimal point.
Prince Edward Island Human Rights Commission
Fiscal year |
Proportion of disability complaints on the total complaints | Proportion of employment-related complaints on the total complaints |
|---|---|---|
| 2009-10 | 36.8% | 76.3% |
| 2010-11 | 44.6% | 75.4% |
| 2011-12 | 46.2% | 44.6% |
| 2012-13 | 41.6% | 78.2% |
| 2013-14 | 59.2% | 67.3% |
| 2014-15 | 37.3% | 74.5% |
| 2015-16 | 49.0% | 60.8% |
All percentages are rounded to one decimal point.
Fiscal year |
Proportion of disability complaints related to employment on the total complaints | Proportion of disability complaints related to employment on the total of disability complaints |
|---|---|---|
| 2009-10 | 31.6% | 85.7% |
| 2010-11 | 27.7% | 62.1% |
| 2011-12 | 26.2% | 56.7% |
| 2012-13 | 27.7% | 66.7% |
| 2013-14 | 40.8% | 69.0% |
| 2014-15 | 31.4% | 84.2% |
| 2015-16 | 33.3% | 68.0% |
All percentages are rounded to one decimal point.
Nova Scotia Human Rights Commission
| Fiscal year | Proportion of disability complaints on the total complaints | Proportion of employment-related complaints on the total complaints |
|---|---|---|
| 2009-10 | 56.5% | 82.1% |
| 2010-11 | 65.4% | 83.8% |
| 2011-12 | 64.8% | 82.6% |
| 2012-13 | 59.7% | 83.8% |
| 2013-14 | 61.5% | 80.4% |
| 2014-15 | 69.0% | 81.0% |
| 2015-16 | 91.0% | 77.9% |
All percentages are rounded to one decimal point.
Fiscal year |
Proportion of disability complaints related to employment on the total complaints | Proportion of disability complaints related to employment on the total of disability complaints |
|---|---|---|
| 2009-10 | 45.6% | 80.6% |
| 2010-11 | 55.4% | 84.7% |
| 2011-12 | 54.3% | 83.8% |
| 2012-13 | 50.5% | 84.5% |
| 2013-14 | 44.8% | 72.9% |
| 2014-15 | 52.7% | 76.4% |
| 2015-16 | 71.0% | 78.0% |
All percentages are rounded to one decimal point.
New Brunswick Human Rights Commission
Fiscal year |
Proportion of disability complaints on the total complaints | Proportion of employment-related complaints on the total complaints |
|---|---|---|
| 2009-10 | 20.8% | 35.5% |
| 2010-11 | 44.0% | 75.5% |
| 2011-12 | 47.1% | 75.9% |
| 2012-13 | 47.1% | 81.5% |
| 2013-14 | 37.1% | 77.1% |
| 2014-15 | 34.3% | 71.4% |
| 2015-16 | 40.1% | 81.0% |
All percentages are rounded to one decimal point.
Fiscal year |
Proportion of disability complaints related to employment on the total complaints | Proportion of disability complaints related to employment on the total of disability complaints |
|---|---|---|
| 2009-10 | 16.0% | 76.8% |
| 2010-11 | 37.0% | 84.0% |
| 2011-12 | 37.4% | 79.3% |
| 2012-13 | 40.8% | 86.5% |
| 2013-14 | 30.7% | 82.7% |
| 2014-15 | 28.6% | 83.3% |
| 2015-16 | 35.0% | 87.3% |
All percentages are rounded to one decimal point.
Commission des droits de la personne et des droits de la jeunesse du Québec
Fiscal year |
Proportion of disability complaints on the total complaints | Proportion of employment-related complaints on the total complaints |
|---|---|---|
| 2009-10 | 26.6% | 43.9% |
| 2010-11 | 31.5% | 46.0% |
| 2011-12 | 34.9% | 48.2% |
| 2012-13 | 31.7% | 42.3% |
| 2013-14 | 31.2% | 48.7% |
| 2014-15 | 34.4% | 51.4% |
| 2015-16 | 38.9% | 51.1% |
All percentages are rounded to one decimal point.
Fiscal year |
Proportion of disability complaints related to employment on the total complaints |
Proportion of disability complaints related to employment on the total of disability complaints |
|---|---|---|
| 2009-10 | 14.5% | 54.5% |
| 2010-11 | 16.6% | 52.5% |
| 2011-12 | 17.7% | 50.7% |
| 2012-13 | 16.1% | 50.9% |
| 2013-14 | 17.1% | 54.8% |
| 2014-15 | 16.4% | 47.7% |
| 2015-16 | 18.2% | 46.7% |
All percentages are rounded to one decimal point.
Human Rights Tribunal of Ontario
Fiscal year |
Proportion of disability complaints on the total complaints | Proportion of employment-related complaints on the total complaints |
|---|---|---|
| 2009-10 | 51.2% | 73.2% |
| 2010-11 | 49.7% | 73.7% |
| 2011-12 | 51.0% | 72.7% |
| 2012-13 | 52.2% | 72.7% |
| 2013-14 | 52.6% | 71.1% |
| 2014-15 | 54.6% | 70.2% |
| 2015-16 | 54.4% | 66.8% |
All percentages are rounded to one decimal point.
Fiscal year |
Proportion of disability complaints related to employment on the total complaints | Proportion of disability complaints related to employment on the total of disability complaints |
|---|---|---|
| 2009-10 | 38.2% | 74.6% |
| 2010-11 | 38.0% | 76.5% |
| 2011-12 | 39.2% | 76.9% |
| 2012-13 | 39.2% | 75.1% |
| 2013-14 | 36.4% | 69.2% |
| 2014-15 | 39.2% | 71.9% |
| 2015-16 | 37.6% | 69.1% |
All percentages are rounded to one decimal point.
Manitoba Human Rights Commission
Calendar year |
Proportion of disability complaints on the total complaints | Proportion of employment-related complaints on the total complaints |
|---|---|---|
| 2009 | 42.1% | 74.0% |
| 2010 | 37.3% | 64.8% |
| 2011 | 51.4% | 68.1% |
| 2012 | 46.2% | 68.4% |
| 2013 | 41.6% | 67.3% |
| 2014 | 45.5% | 69.0% |
| 2015 | 44.9% | 66.9% |
| 2016 | 44.5% | 66.6% |
All percentages are rounded to one decimal point.
Calendar year |
Proportion of disability complaints related to employment on the total complaints | Proportion of disability complaints related to employment on the total of disability complaints |
|---|---|---|
| 2009 | 32.3% | 76.8% |
| 2010 | 23.6% | 63.2% |
| 2011 | 33.5% | 65.1% |
| 2012 | 32.0% | 69.3% |
| 2013 | 26.7% | 64.1% |
| 2014 | 29.3% | 64.4% |
| 2015 | 29.1% | 64.7% |
| 2016 | 26.6% | 59.7% |
All percentages are rounded to one decimal point.
Alberta Human Rights Commission
Fiscal year |
Proportion of disability complaints on the total complaints | Proportion of employment-related complaints on the total complaints |
|---|---|---|
| 2009-10 | 47.7% | 86.1% |
| 2010-11 | 43.4% | 83.7% |
| 2011-12 | 47.9% | 86.9% |
| 2012-13 | 52.7% | 85.4% |
| 2013-14 | 49.1% | 84.8% |
| 2014-15 | 51.3% | 85.3% |
| 2015-16 | 51.5% | 86.1% |
All percentages are rounded to one decimal point.
Fiscal year |
Proportion of disability complaints related to employment on the total complaints | Proportion of disability complaints related to employment on the total of disability complaints |
|---|---|---|
| 2009-10 | 42.3% | 88.7% |
| 2010-11 | 38.7% | 89.2% |
| 2011-12 | 42.2% | 88.2% |
| 2012-13 | 46.0% | 87.2% |
| 2013-14 | 42.9% | 87.3% |
| 2014-15 | 44.9% | 87.7% |
| 2015-16 | 45.5% | 88.4% |
All percentages are rounded to one decimal point.
Yukon Human Rights Commission
Calendar year |
Proportion of disability complaints on the total complaints |
Proportion of employment-related complaints on the total complaints |
|---|---|---|
| 2009 | 39.1% | 78.3% |
| 2010 | 50.0% | 66.7% |
| 2011 | 60.0% | 80.0% |
| 2012 | 36.7% | 73.3% |
| 2013 | 37.5% | 75.0% |
| 2014 | 48.4% | 48.4% |
| 2015 | 52.2% | 73.9% |
| 2016 | 62.5% | 37.5% |
All percentages are rounded to one decimal point.
Calendar year |
Proportion of disability complaints related to employment on the total complaints | Proportion of disability complaints related to employment on the total of disability complaints |
|---|---|---|
| 2009 | 21.7% | 55.6% |
| 2010 | 25.0% | 50.0% |
| 2011 | 53.3% | 88.9% |
| 2012 | 23.3% | 63.6% |
| 2013 | 25.0% | 66.7% |
| 2014 | 22.6% | 46.7% |
| 2015 | 34.8% | 66.7% |
| 2016 | 21.9% | 35.0% |
All percentages are rounded to one decimal point.
Annex B: Chart and Tables from the 2012 Canada Disability Survey
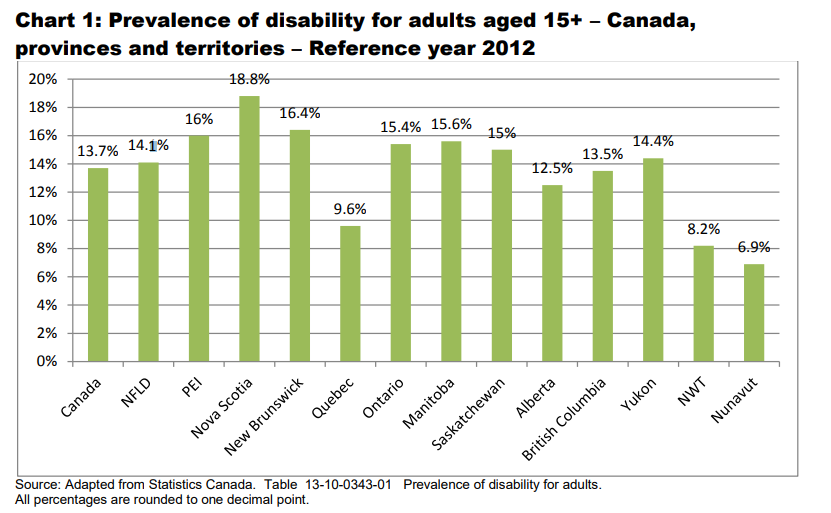
Chart 1 - Text version
| Canada | 13.7% |
|---|---|
| Newfoundland and Labrador | 14.1% |
| Prince Edward Island | 16% |
| Nova Scotia | 18.8% |
| New Brunswick | 16.4% |
| Quebec | 9.6% |
| Ontario | 15.4% |
| Manitoba | 15.6% |
| Saskatchewan | 15% |
| Alberta | 12.5% |
| British Columbia | 13.5% |
| Yukon | 14.4% |
| Northwest Territories | 8.2% |
| Nunavut | 6.9% |
Source: Adapted from Statistics Canada. Table 13-10-0343-01 Prevalence of disability for adults. All percentages are rounded to one decimal point.
| Province | Women 15-24 | Men 15-24 | Women 25-44 | Men 25-44 | Women 45-64 | Men 45-64 | Women 65-74 | Men 65-74 | Women 75+ | Men 75+ | Women 15+ | Men 15+ |
|---|---|---|---|---|---|---|---|---|---|---|---|---|
| Canada | 4.3% | 4.5% | 7.1% | 6.0% | 17.1% | 15.2% | 27.5% | 25.0% | 44.5% | 39.8% | 14.9% | 12.5% |
| Newfoundland and Labrador | 5.0% | 5.1% | 7.7% | 7.7% | 17.0% | 16.4% | 20.9% | 21.3% | 39.7% | 34.8% | 14.6% | 13.6% |
| Prince Edward Island | 3.9%E | 4.7%E | 9.8% | 6.6% | 19.2% | 16.8% | 29.8% | 28.3% | 48.9% | 47.4% | 17.3% | 14.7% |
| Nova Scotia | 5.5% | 6.1% | 10.7% | 7.8% | 22.1% | 21.1% | 32.0% | 36.1% | 44.9% | 52.2% | 19.2% | 18.4% |
| New Brunswick | 3.5% | 4.3% | 8.9% | 7.5% | 19.5% | 18.4% | 27.0% | 29.7% | 45.9% | 43.2% | 17.2% | 15.6% |
| Quebec | 3.1% | 3.0% | 4.6% | 4.0% | 10.8% | 10.2% | 17.5% | 16.7% | 35.4% | 29.2% | 10.4% | 8.3% |
| Ontario | 4.6% | 5.3% | 8.0% | 7.4% | 19.3% | 17.0% | 33.8% | 25.8% | 48.5% | 43.4% | 14.2% | 14.0% |
| Manitoba | 4.1% | 4.1% | 8.6% | 6.6% | 19.8% | 16.4% | 32.2% | 31.0% | 49.0% | 49.1% | 17.1% | 14.2% |
| Saskatchewan | 4.6% | 3.6% | 7.3% | 5.8% | 18.9% | 16.6% | 27.6% | 32.1% | 45.5% | 43.8% | 16.0% | 13.9% |
| Alberta | 4.9% | 4.1% | 6.4% | 4.7% | 17.6% | 15.2% | 28.7% | 30.5% | 44.3% | 43.9% | 13.5% | 11.4% |
| British Columbia | 4.8% | 4.7% | 7.6% | 5.7% | 18.6% | 16.4% | 26.3% | 28.5% | 48.0% | 38.5% | 16.0% | 13.5% |
| Yukon | F | F | 8.2%E | 4.4%E | 18.6% | 19.6% | 31.8% | 42.2% | 59.5% | 48.6%E | 14.5% | 14.2% |
| Northwest Territories | F | 1.6%E | 5.0% | 3.1% | 11.9% | 11.3% | 40.3% | 30.0% | 52.6% | 32.4%E | 9.1% | 7.3% |
| Nunavut | 2.3% | 0.9%E | 5.4% | 4.2% | 11.7% | 11.4% | 34.3% | 30.6% | 50.0% | 38.5% | 7.4% | 6.5% |
Source: Adapted from Statistics Canada. Table 13-10-0343-01 Prevalence of disability for adults.
All percentages are rounded to one decimal point.
E Use with caution. F Too unreliable to be published.
Province |
Persons with disabilities |
Persons without disabilities |
Women with disabilities | Women without disabilities |
Men with disabilities | Men without disabilities |
|---|---|---|---|---|---|---|
| Canada | 47.3% | 73.6% | 45.0% | 70.1% | 49.8% | 77.1% |
| Newfoundland and Labrador | 40.4% | 64.3% | 33.5% | 60.8% | 47.9% | 67.8% |
| Prince Edward Island | 51.2% | 75.2% | 48.8% | 73.4% | 54.1% | 77.0% |
| Nova Scotia | 47.9% | 71.9% | 43.2% | 70.3% | 53.4% | 73.6% |
| New Brunswick | 41.2% | 71.4% | 41.0% | 69.5% | 41.5% | 73.5% |
| Quebec | 39.9% | 72.9% | 41.4% | 70.1% | 38.2% | 75.7% |
| Ontario | 45.5% | 72.8% | 43.3% | 70.0% | 48.0% | 75.7% |
| Manitoba | 56.4% | 77.3% | 52.4% | 73.1% | 61.3% | 81.4% |
| Saskatchewan | 60.6% | 78.6% | 57.3% | 73.6% | 64.5% | 83.5% |
| Alberta | 59.3% | 78.8% | 54.3% | 72.7% | 65.0% | 84.4% |
| British Columbia | 48.4% | 72.7% | 44.9% | 68.2% | 52.6% | 77.1% |
| Yukon | 59.4% | 77.6% | 55.8% | 76.0% | 63.3% | 79.3% |
| Northwest Territories | 51.9% | 70.4% | 51.6% | 68.5% | 51.1% | 71.2% |
| Nunavut | 55.5% | 54.1% | 42.4% | 53.8% | 69.2% | 54.3% |
Source: Adapted from Statistics Canada. Table 13-10-0347-01 Labour force status for adults with and without disabilities All percentages are rounded to one decimal point
Province |
Persons with disabilities |
Persons without disabilities |
Women with disabilities | Women without disabilities |
Men with disabilities | Men without disabilities |
|---|---|---|---|---|---|---|
| Canada | 28.4% | 20.6% | 32.0% | 28.4% | 24.7% | 14.6% |
| Atlantic Provinces | 27.1% | 19.3% | 37.0% | 26.5% | 18.1% | 12.6% |
| Quebec | 29.9% | 19.9% | 36.3% | 26.9% | 23.4% | 13.7% |
| Ontario | 26.4% | 21.2% | 26.6% | 27.5% | 26.3% | 15.5% |
| Manitoba | 29.8% | 22.7% | 36.1% | 31.7% | 23.9% | 15.0% |
| Saskatchewan | 29.7% | 20.6% | 33.8% | 29.3% | 26.1% | 13.2% |
| Alberta | 26.6% | 19.7% | 34.5% | 29.3% | 19.3% | 11.8% |
| British - Columbia | 34.1% | 25.2% | 38.1% | 33.4% | 30.3% | 17.9% |
| Territories | 20.9% | 15.8% | 20.5%**/*** | 20.4%** | 21.2%*** | 11.9% |
Source: 2012 Canada Survey on Disability.
All percentages are rounded to one decimal point.
Missing values are excluded.
** Difference between women with and without disabilities is not statistically significant at 0.05.
*** Difference between women and men with disabilities is not statistically significant at 0.05.
| Province | Women with disabilities | Men with disabilities | Total disabled population |
|---|---|---|---|
| Canada | 38.9% | 41.9% | 40.3% |
| Atlantic Provinces | 38.5% | 39.3% | 38.9% |
| Quebec | 35.0% | 44.9% | 40.0% |
| Ontario | 40.4% | 44.4% | 42.1% |
| Manitoba | 35.4% | 38.3% | 36.8% |
| Saskatchewan | 33.2% | 34.0% | 33.6% |
| Alberta | 36.3% | 37.4% | 36.8% |
| British Columbia | 42.8% | 41.1% | 42.0% |
| Territories | 31.1% | 36.8% | 33.9% |
Source: 2012 Canada Survey on Disability.
All percentages are rounded to one decimal point.
Missing values are excluded
| Province | Women with disabilities | Men with disabilities | Total disabled population |
|---|---|---|---|
| Canada | 41.5% | 43.7% | 42.5% |
| Atlantic Provinces | 39.6% | 43.6% | 41.6% |
| Quebec | 40.3% | 47.4% | 43.9% |
| Ontario | 44.3% | 44.9% | 44.6% |
| Manitoba | 39.0% | 42.5% | 40.7% |
| Saskatchewan | 41.1%*** | 41.0%*** | 41.0% |
| Alberta | 33.1% | 40.8% | 37.0% |
| British Columbia | 42.6% | 40.7% | 41.6% |
| Territories | 23.9% | 36.6% | 30.1% |
Source: 2012 Canada Survey on Disability.
All percentages are rounded to one decimal point.
Missing values are excluded.
*** Difference between women and men with disabilities is not statistically significant at 0.05.
| Province | Women with disabilities | Men with disabilities | Total disabled population |
|---|---|---|---|
| Canada | 44.6% | 46.7% | 45.6% |
| Atlantic Provinces | 48.1% | 51.6% | 49.7% |
| Quebec | 46.9% | 54.9% | 50.9% |
| Ontario | 46.7%*** | 47.0%*** | 46.8% |
| Manitoba | 33.8% | 44.9% | 39.1% |
| Saskatchewan | 37.4%*** | 37.7%*** | 37.5% |
| Alberta | 36.8% | 47.9% | 42.4% |
| British Columbia | 45.2% | 36.1% | 41.0% |
| Territories | 39.9% | 36.3%E | 38.2% |
Source: 2012 Canada Survey on Disability.
All percentages are rounded to one decimal point.
Missing values are excluded.
E Use with caution.
*** Difference between women and men with disabilities is not statistically significant at 0.05.
| Women with disabilities | Men with disabilities | Total disabled population |
|---|---|---|
| 27.8% | 32.5%E | 29.6%E |
Source: 2012 Canada Survey on Disability.
All percentages are rounded to one decimal point.
Missing values are excluded.
E Use with caution.
| Province | Women with disabilities | Men with disabilities | Total disabled population | ||
|---|---|---|---|---|---|
| Canada | 7.5% | 8.3% | 7.9% | ||
| Atlantic Provinces | 4.8%E | 7.4% | 6.2% | ||
| Quebec | 6.9%E | 4.6%E | 5.7%E | ||
| Ontario | 7.9%E | 8.8%E | 8.3%E | ||
| Manitoba | 6.2%E | 7.8%E | 6.9%E | ||
| Saskatchewan | 6.2%E *** | 5.9%E *** | 6.1%E | ||
| Alberta | 7.6%E | 10.8%E | 9.2%E | ||
| British Columbia | 9.2%E | 9.6%E | 9.4%E | ||
| Territories | 9.3%E | 7.8%E | 8.5%E | ||
Source: 2012 Canada Survey on Disability.
All percentages are rounded to one decimal point.
Missing values are excluded.
E Use with caution.
*** Difference between women and men with disabilities is not statistically significant at 0.05.
| Province | Women with disabilities | Men with disabilities | Total disabled population | |
|---|---|---|---|---|
| Canada | 22.5% | 23.7% | 23.1% | |
| Atlantic Provinces | 20.2% | 23.2% | 21.7% | |
| Quebec | 21.7%*** | 21.9%*** | 21.8% | |
| Ontario | 22.9% | 20.9% | 21.9% | |
| Manitoba | 22.0% | 23.6% | 22.8% | |
| Saskatchewan | 28.6% | 25.4% | 25.4% | |
| Alberta | 19.2% | 32.8% | 32.8% | |
| British Columbia | 24.8%*** | 25.0%E *** | 25.0% | |
| Territories | 22.2%E *** | 21.5%E *** | 22.4% | |
Source: 2012 Canada Survey on Disability.
All percentages are rounded to one decimal point.
Missing values are excluded.
E Use with caution.
*** Difference between women and men with disabilities is not statistically significant at 0.05.
| Province | Women with disabilities | Men with disabilities | Total disabled population | |
|---|---|---|---|---|
| Canada | 38.0% | 34.6% | 36.3% | |
| Atlantic Provinces | 33.9% | 31.1% | 32.5% | |
| Quebec | 37.4% | 32.5% | 34.9% | |
| Ontario | 38.6% | 34.7% | 36.7% | |
| Manitoba | 41.7% | 35.1% | 38.5% | |
| Saskatchewan | 44.0% | 39.2% | 41.5% | |
| Alberta | 32.1% | 30.4% | 31.2% | |
| British Columbia | 40.8%*** | 40.9%*** | 40.9% | |
| Territories | 30.1%*** | 30.2%E *** | 31.0% | |
Source: 2012 Canada Survey on Disability.
All percentages are rounded to one decimal point.
Missing values are excluded.
E Use with caution.
*** Difference between women and men with disabilities is not statistically significant at 0.05.
| Province | Women with disabilities | Men with disabilities | Total disabled population |
|---|---|---|---|
| Canada | 28.8% | 31.8% | 30.3% |
| Atlantic Provinces | 27.2% | 31.6% | 29.4% |
| Quebec | 23.4% | 29.6% | 26.6% |
| Ontario | 27.8% | 30.4% | 29.0% |
| Manitoba | 29.4% | 33.1% | 31.2% |
| Saskatchewan | 30.0% | 37.0% | 37.0% |
| Alberta | 26.7% | 34.9% | 34.9% |
| British Columbia | 38.4% | 33.6% | 33.6% |
| Territories | 27.5% | 30.6%E | 31.7%E |
Source: 2012 Canada Survey on Disability.
All percentages are rounded to one decimal point.
Missing values are excluded.
E Use with caution.
*** Difference between women and men with disabilities is not statistically significant at 0.05.
| Province | Women with disabilities | Men with disabilities | Total disabled population |
|---|---|---|---|
| Canada | 44.3% | 45.8% | 45.0% |
| Atlantic Provinces | 41.8% | 48.3% | 45.0% |
| Quebec | 39.0% | 49.4% | 44.3% |
| Ontario | 41.1% | 44.3% | 42.7% |
| Manitoba | 47.4% | 42.2% | 44.9% |
| Saskatchewan | 47.2% | 54.0% | 50.8% |
| Alberta | 47.7% | 41.3% | 44.4% |
| British Columbia | 55.2% | 48.0% | 51.7% |
| Territories | 36.5% | 49.9% | 43.5% |
Source: 2012 Canada Survey on Disability.
All percentages are rounded to one decimal point.
Missing values are excluded.
| Province | Women with disabilities | Men with disabilities | Total disabled population |
|---|---|---|---|
| Canada | 7.4% | 8.0% | 7.7% |
| Atlantic Provinces | 6.7% | 8.3% | 7.5% |
| Quebec | 6.4%E | 7.4%E | 6.9%E |
| Ontario | 7.8% | 7.3%E | 7.6%E |
| Manitoba | 7.4%E | 15.1%E | 11.1%E |
| Saskatchewan | 8.8%E | 10.6%E | 9.7% |
| Alberta | 7.7%E | 8.4% | 8.1% |
| British Columbia | 6.9%E | 7.3%E | 7.1% |
| Territories | 8.6%*** | 8.1%E *** | 8.4% |
Source: 2012 Canada Survey on Disability.
All percentages are rounded to one decimal point.
Missing values are excluded.
E Use with caution.
*** Difference between women and men with disabilities is not statistically significant at 0.05.
| Province | Women with disabilities | Men with disabilities | Total disabled population |
|---|---|---|---|
| Canada | 10.6% | 12.8% | 11.6% |
| Atlantic Provinces | 9.1% | 13.9% | 11.2% |
| Quebec | 12.4% | 16.9%E | 14.7%E |
| Ontario | 10.5% | 10.3% | 10.4% |
| Manitoba | 11.7% | 17.9% | 14.7% |
| Saskatchewan | 11.3%E | 14.1% | 12.7%E |
| Alberta | 10.4% | 12.8% | 11.6% |
| British Columbia | 9.7% | 12.7% | 11.2% |
| Territories | 11.4%*** | 11.0%E *** | 10.9%E |
Source: 2012 Canada Survey on Disability.
All percentages are rounded to one decimal point.
Missing values are excluded.
E Use with caution.
*** Difference between women and men with disabilities is not statistically significant at 0.05.